Content Strategy
The Content Strategy tab is focused on providing insights into your content engagement metrics and recommendations for improving content re-use. It has two different dashboards –
-
Re-Use Recommendations
-
Engagement Trends
Re-Use Recommendations
In this dashboard, you'll receive tailored recommendations on how to effectively reuse your existing content to maximize its reach and impact. Utilize these suggestions to repurpose content or identify opportunities for content syndication.
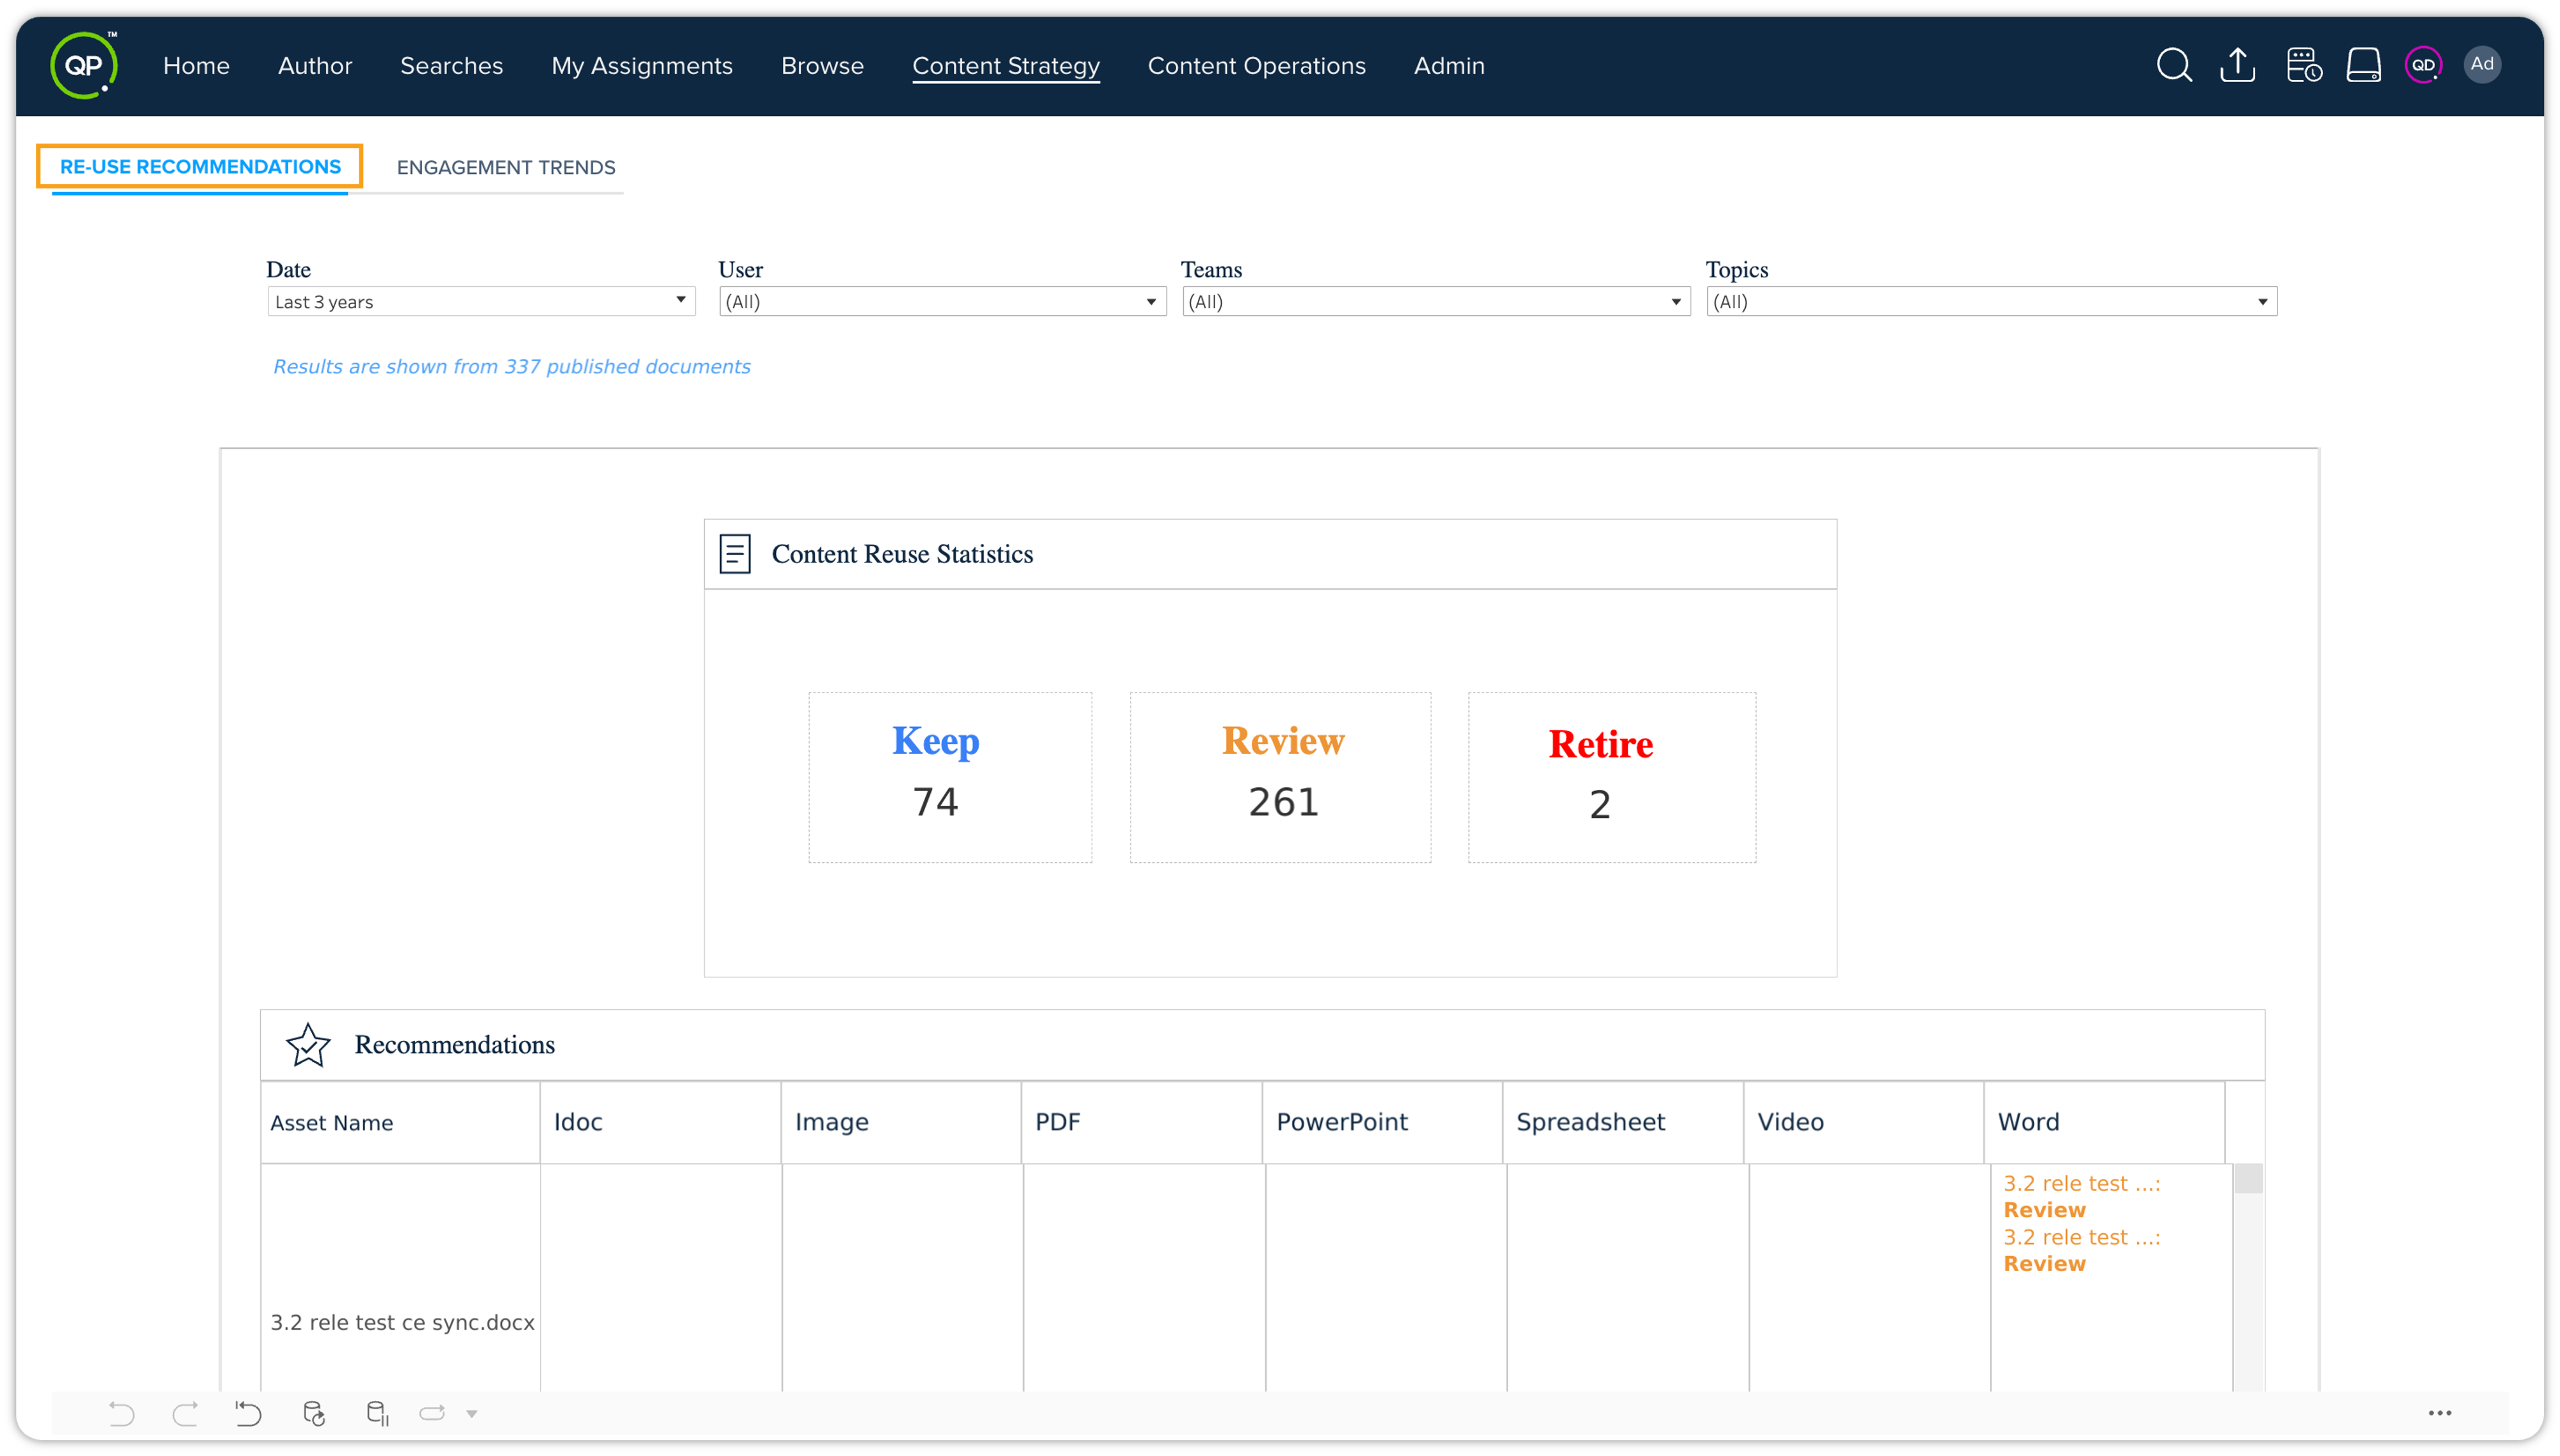
The three types of recommendations are –
-
Keep: Documents with Keep recommendation are basically recently viewed documents, i.e., the ones that have been uploaded/shared/viewed in the last 90 days (about 3 months). This recommendation type tells that the documents are of rich quality, so users are engaged with them.
-
Review: Documents with Review recommendation are the ones uploaded/shared/viewed in the last 90 to 180 days (about 6 months). This recommendation type tells that the documents haven't been uploaded/shared/viewed recently, and therefore there is scope for improvement.
-
Retire: Documents with Retire recommendation are the ones that haven't been uploaded/shared/viewed in the last 180 days (about 6 months), hence they are outdated or not up-to-the-mark. This recommendation type tells that the documents don't have the quality, and therefore they should be unpublished because users are not engaged with them anymore.
Filter Options
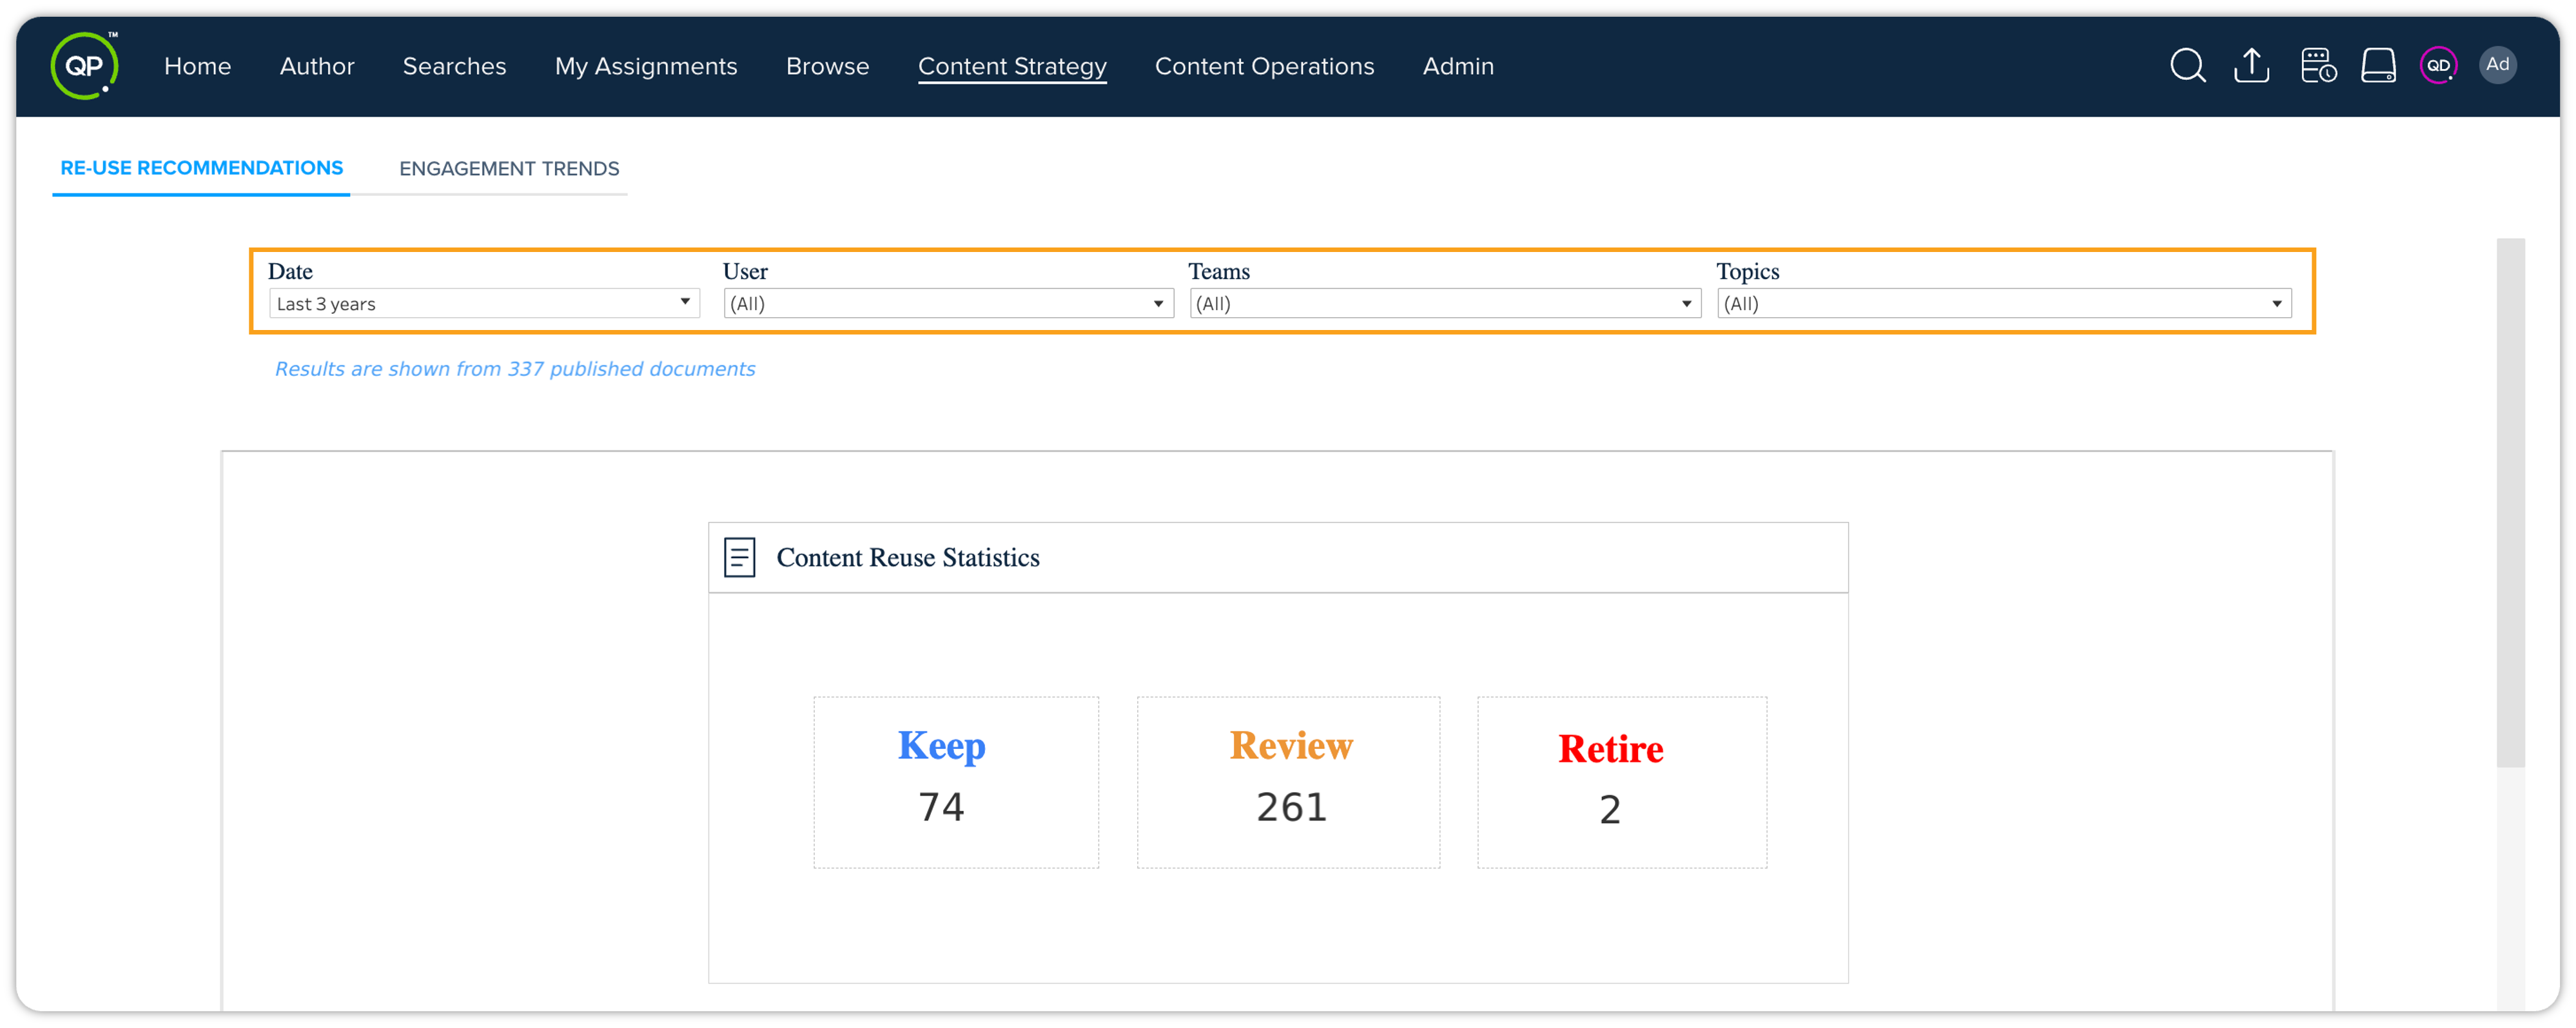
There are four filter options to filter re-use recommendations by date, user, teams, and topics.
Engagement Trends
The Engagement Trends dashboard displays the statistics related to engagement with the published output of your content. It allows you to track and analyze the performance of your content in terms of engagement metrics like views, shares, likes, etc. The page displays two sets of vertical and horizontal stacked bar chart graphs, which are color-coded for output types: PDF, iDoc, Image, PowerPoint, Spreadsheet, Video, and Word.
Use the graphs and charts provided to identify trends and patterns in your content's engagement levels over time.
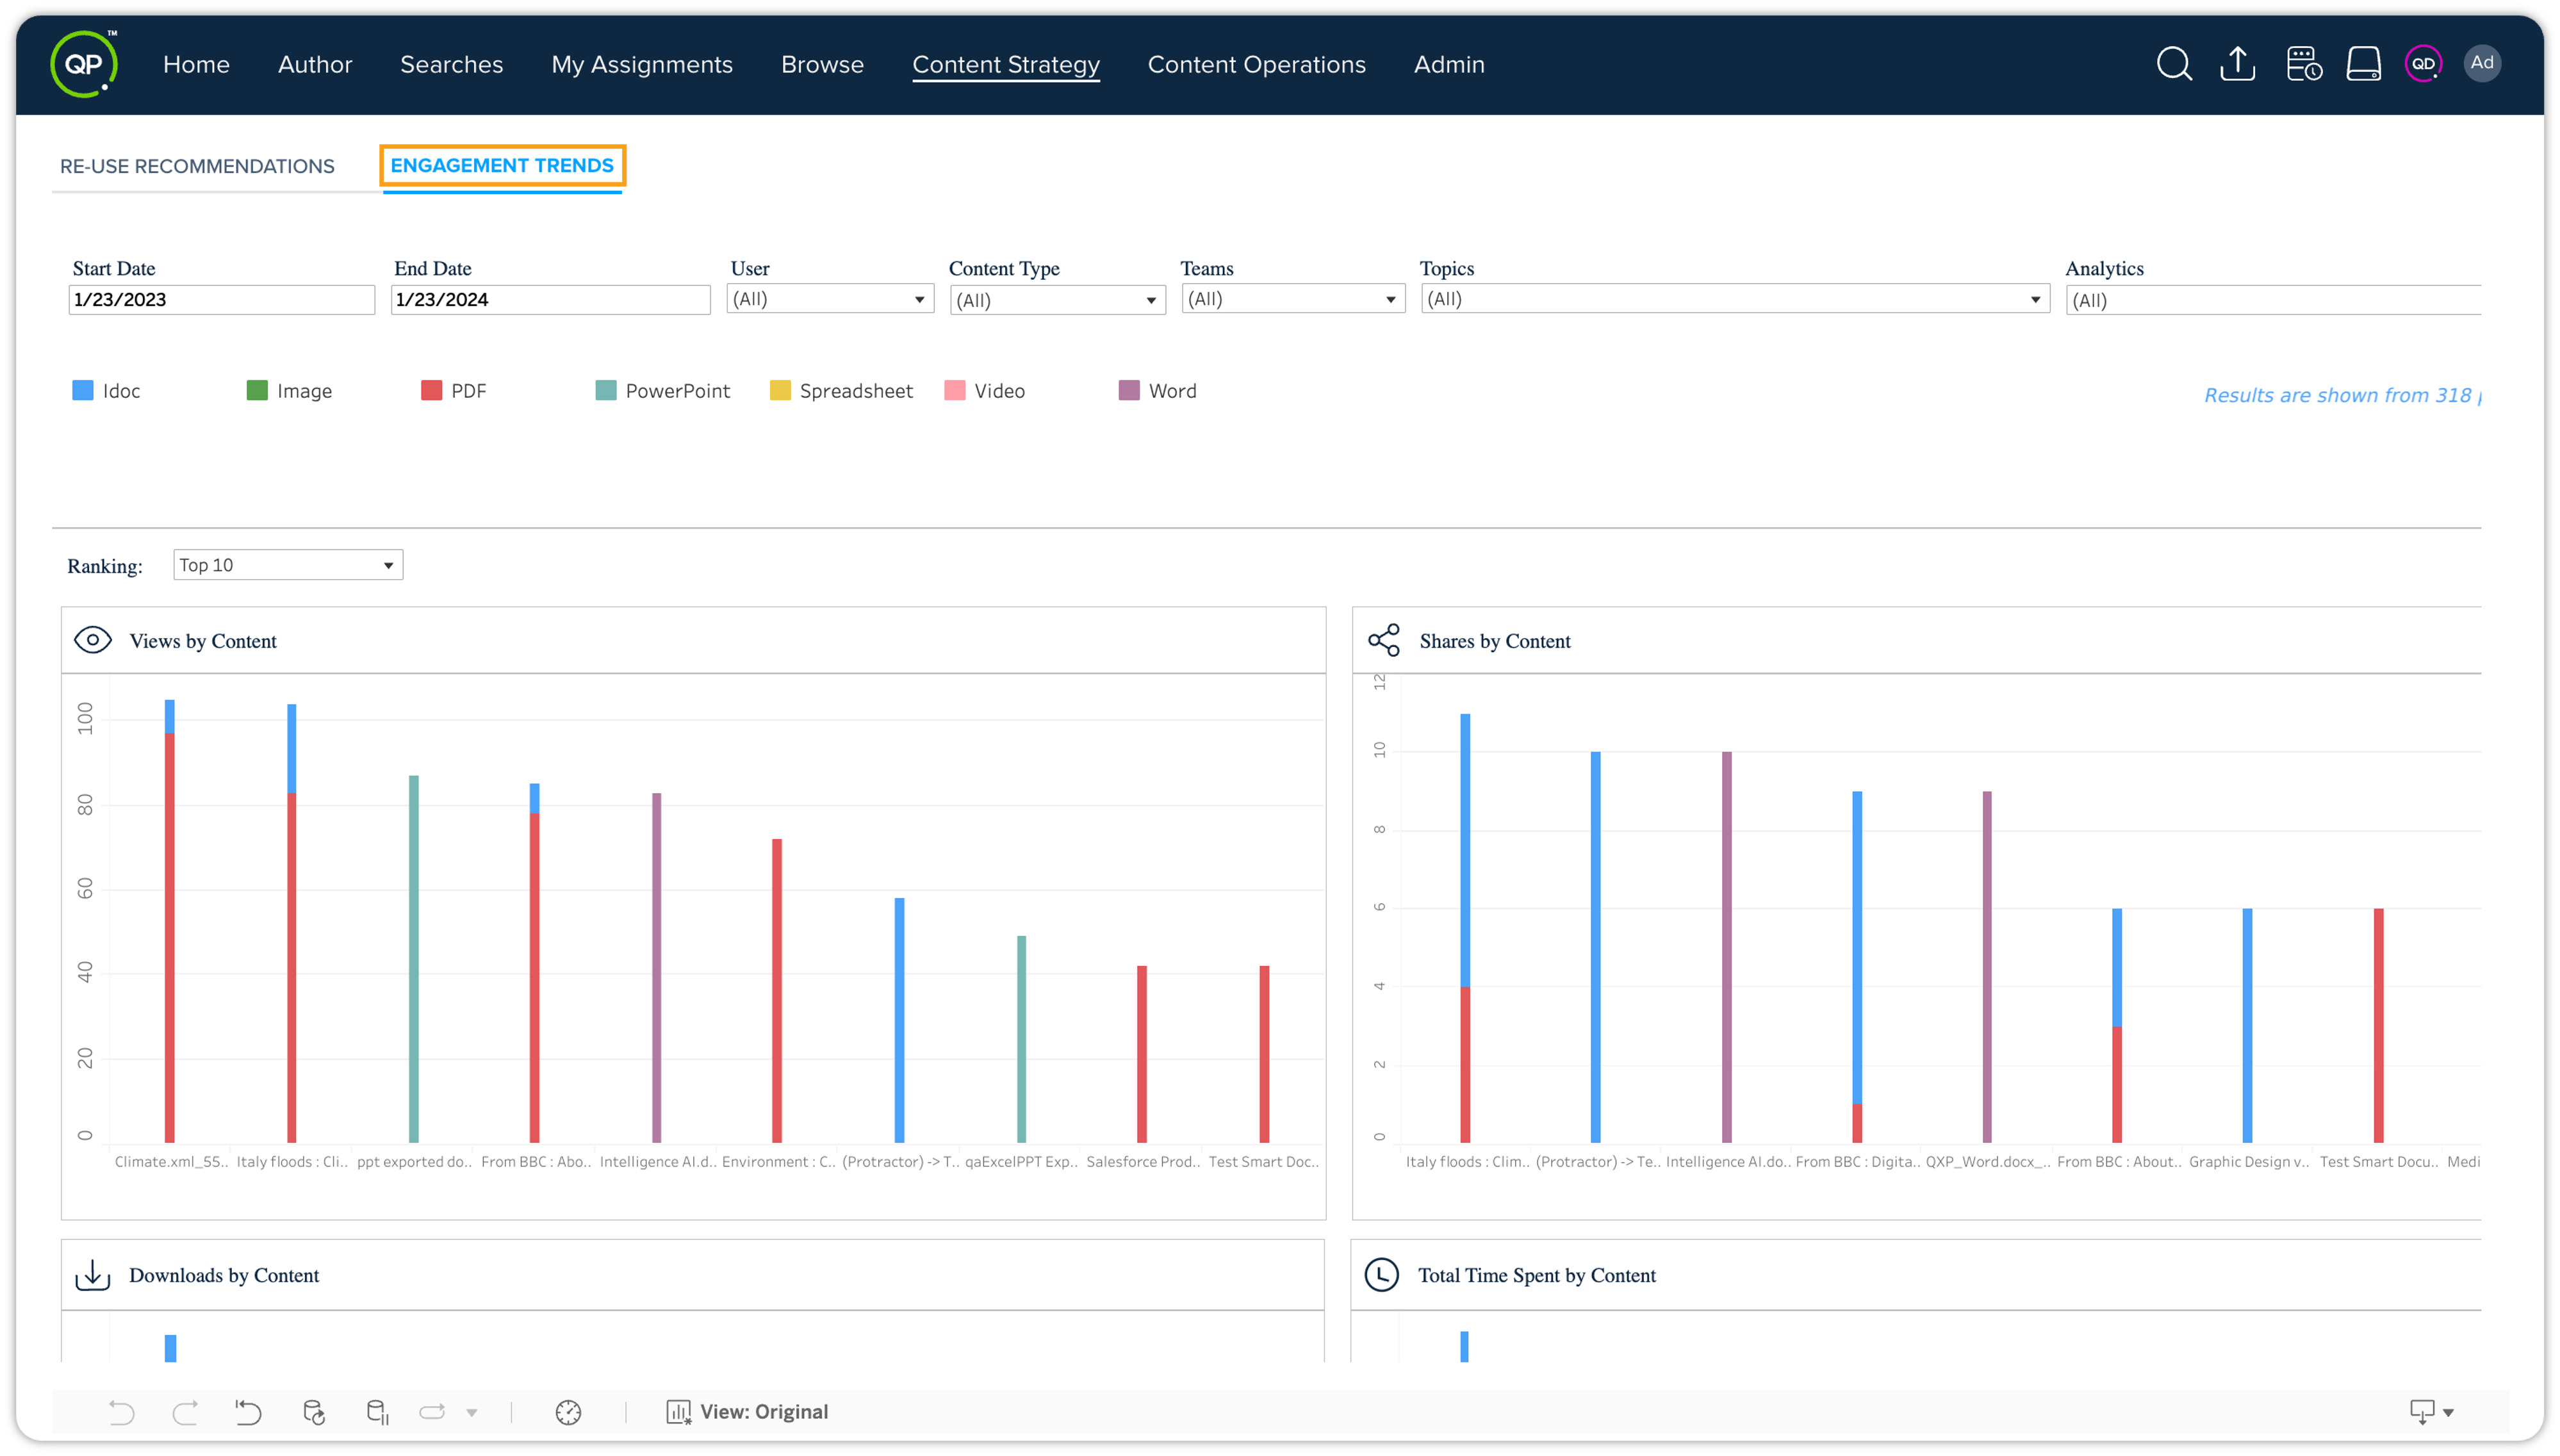
The first set of graphs displays the following statistics by content piece (asset name) –
-
Views
-
Shared
-
Downloads
-
Total Time Spent
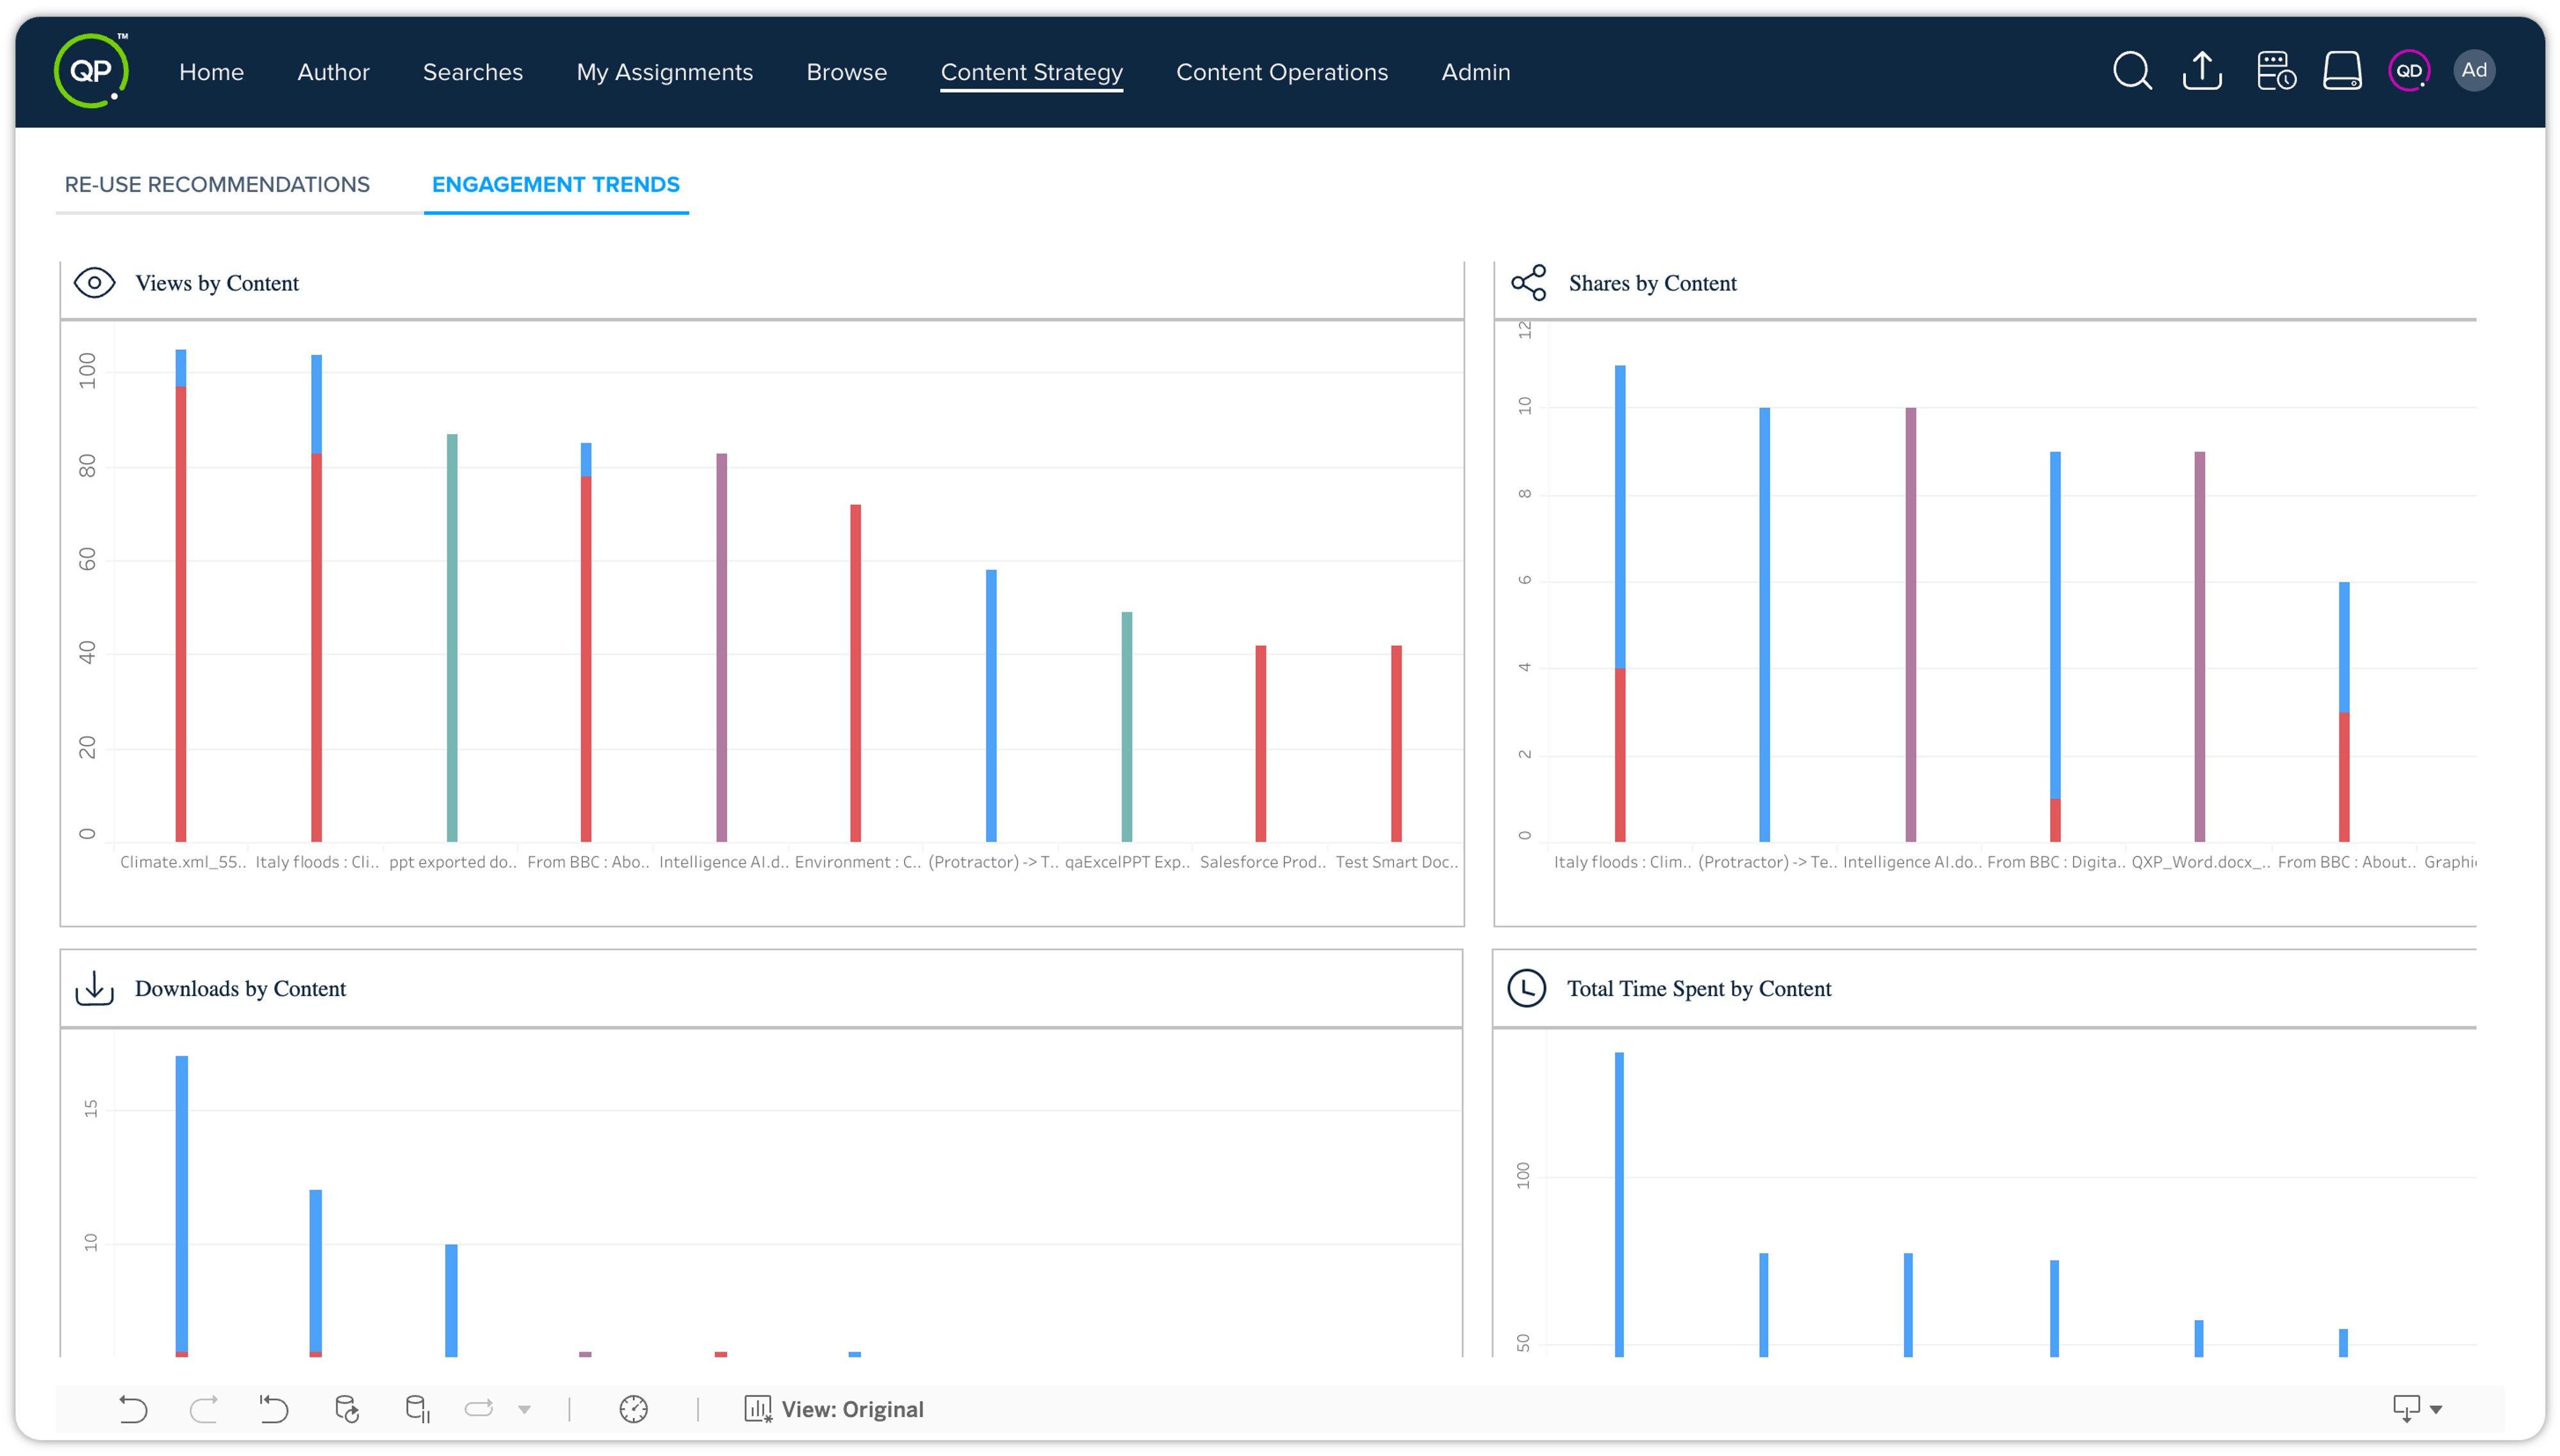
All the graphs are interactive, and you can hover over or select a particular bar to see the exact value and asset name. You have the option to narrow down the search statistics by utilizing the following filters –
-
Date Range: Select the specific date range (start & end dates) to view statistics within the chosen period.
-
User: Filter the statistics based on a specific user to analyze their interactions with the content pieces.
-
Content Type: Choose a particular content type to focus on specific categories of content pieces.
-
Teams: Filter the statistics based on the teams associated with the content pieces.
-
Topics: Select a specific topic to view statistics related to content pieces within that topic.
-
Analytics: Utilize advanced analytics filters to customize and view the statistics based on specific analytical parameters. This includes both internal and external analytics for comprehensive insights.

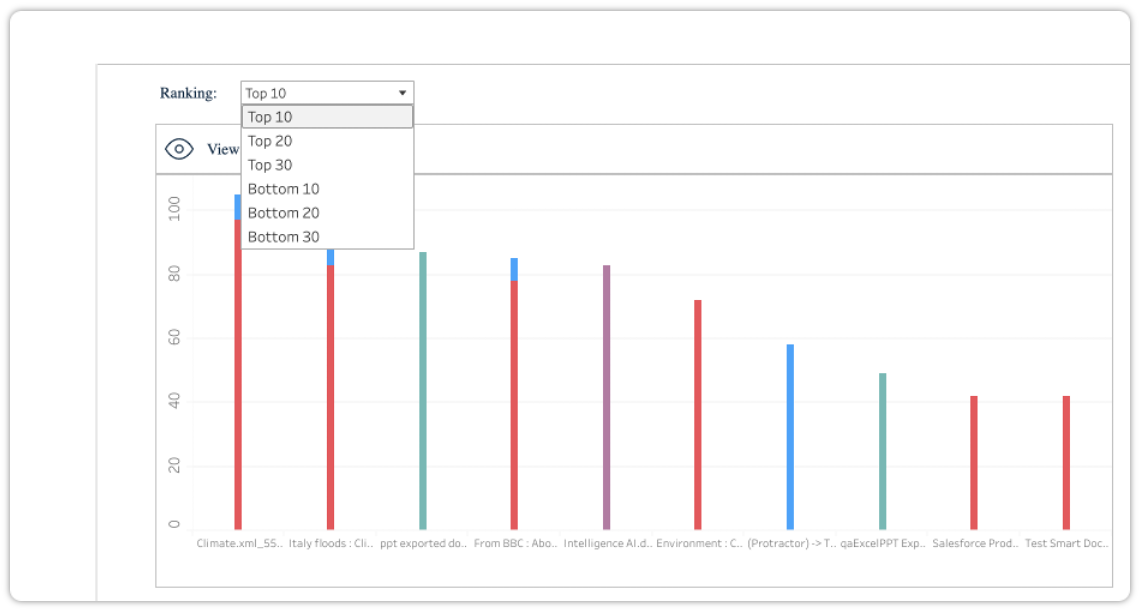
Additionally, you can also choose the number of results you want to see in these graphs through the dropdown menu Ranking.
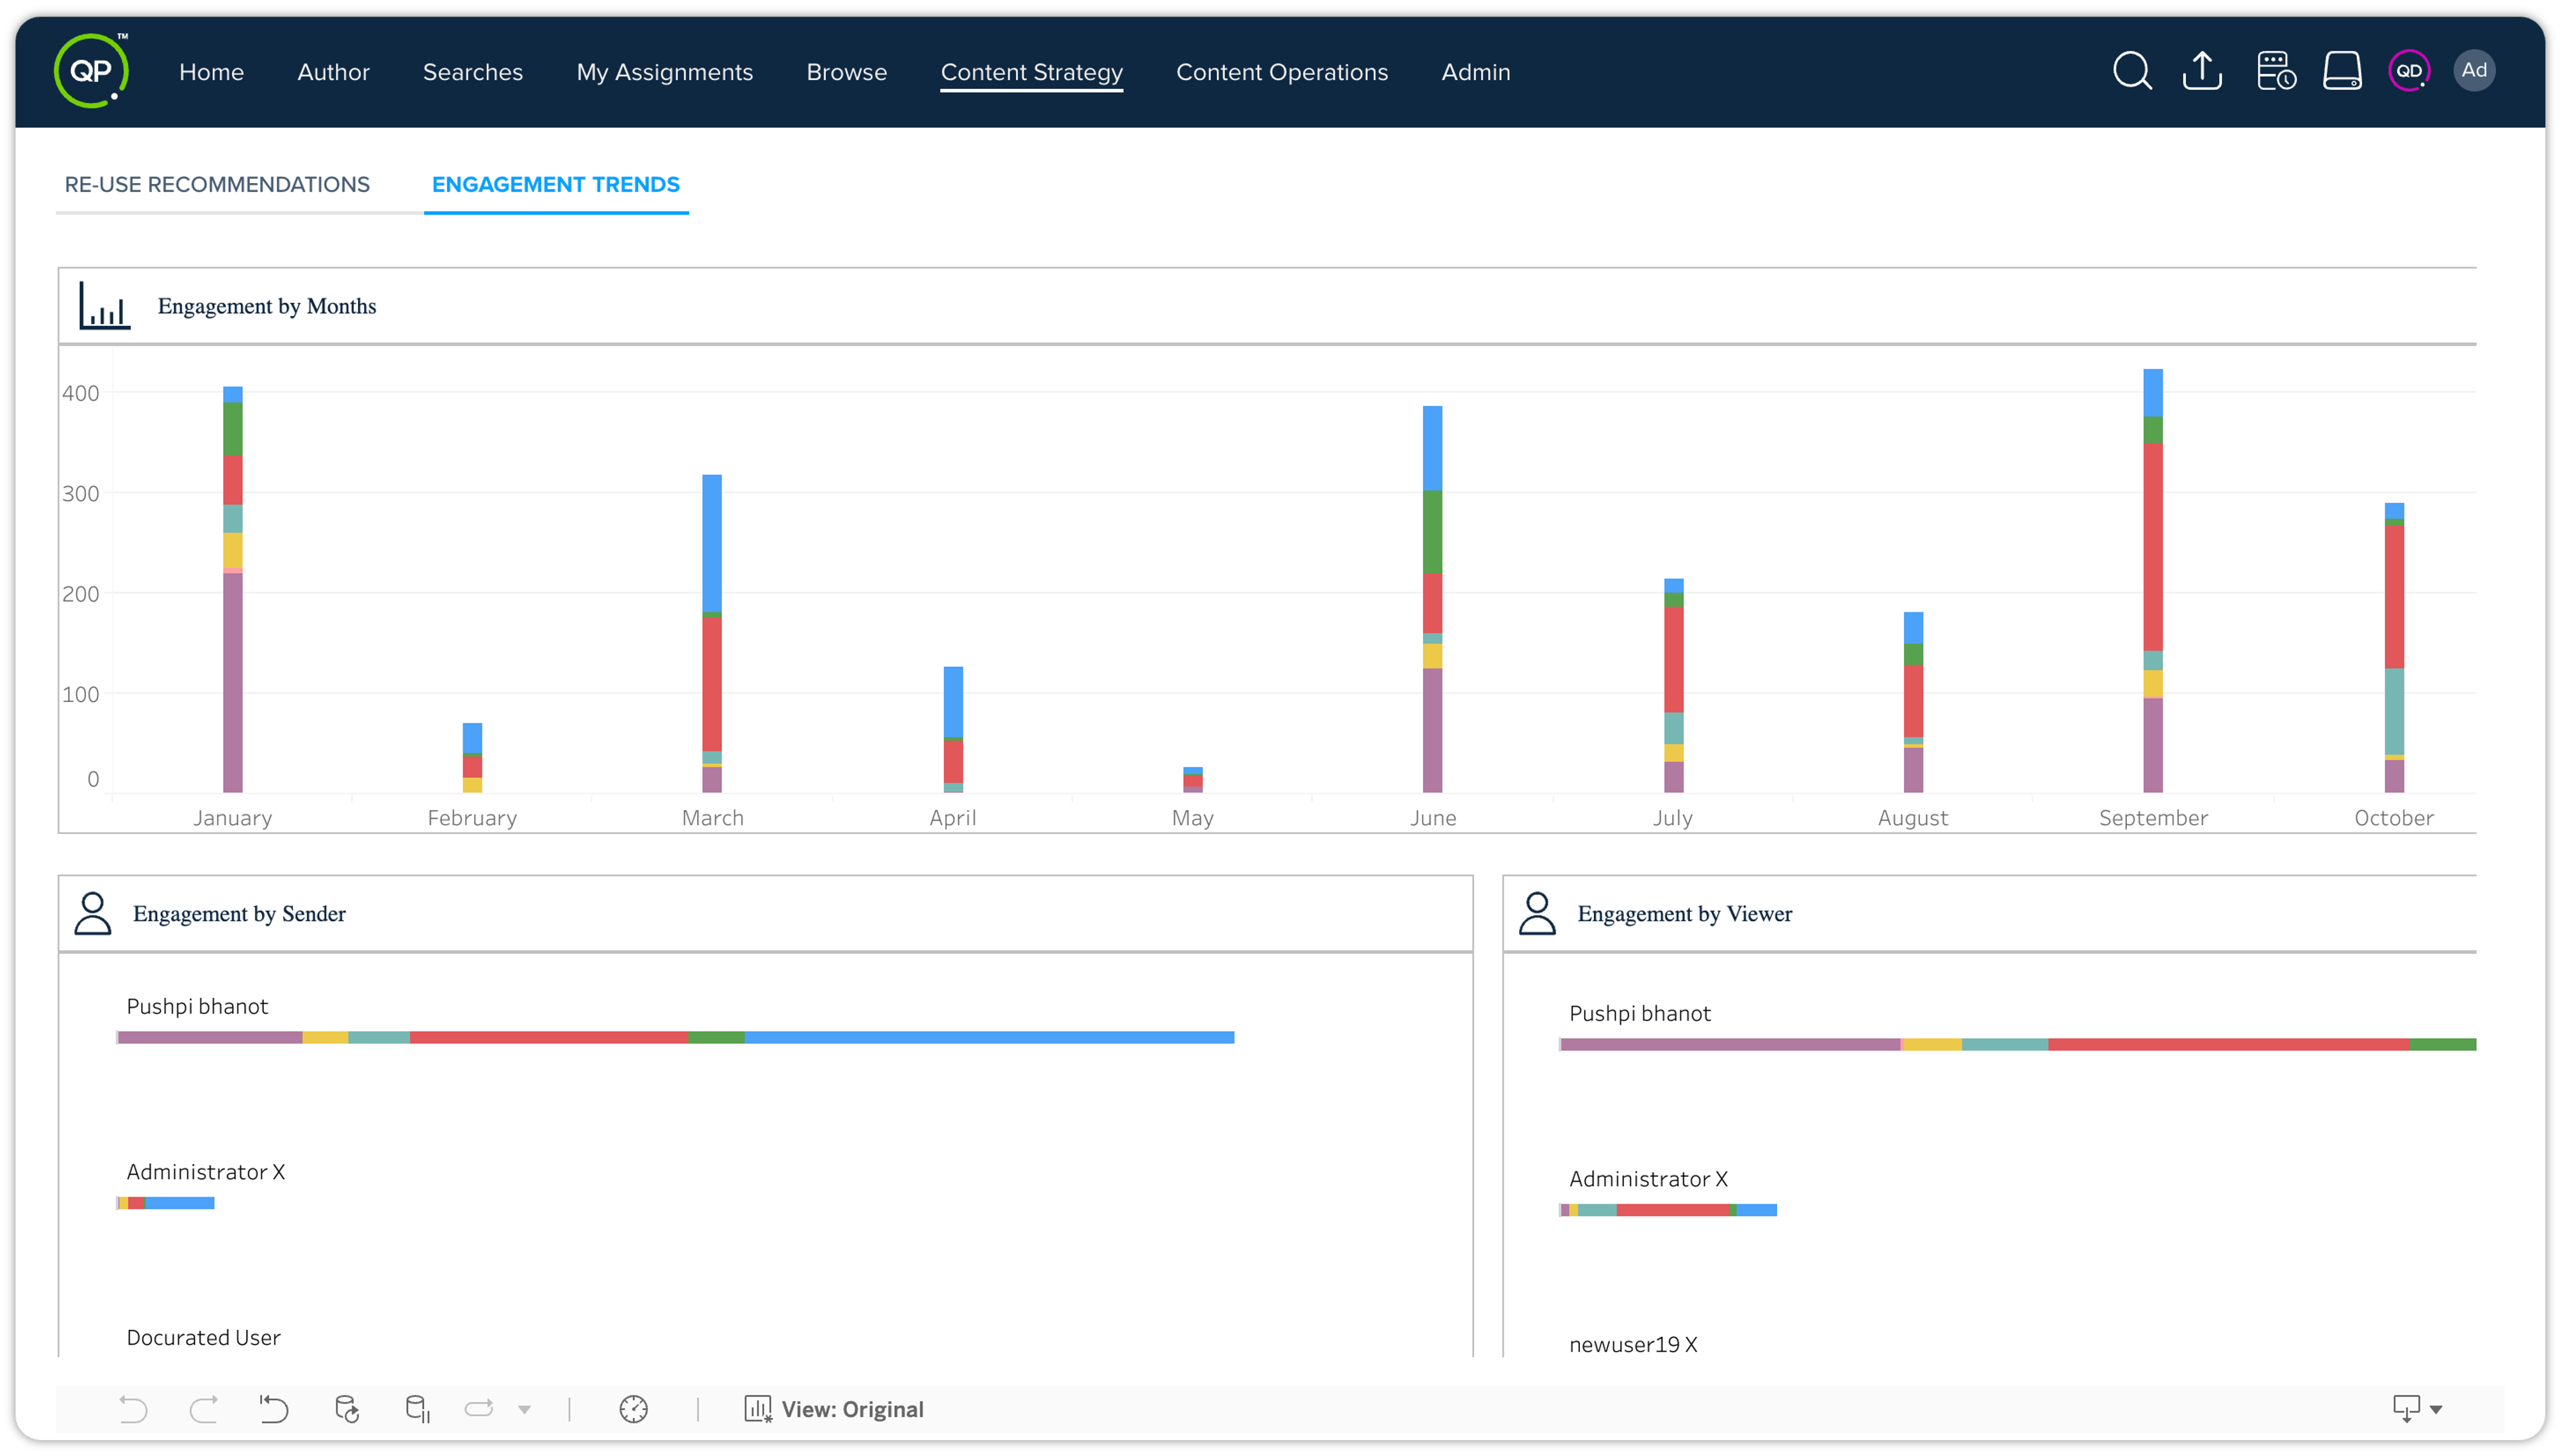
The second set of graphs displays the engagement statistics (number of views) based on months, sender, viewer, and content piece.
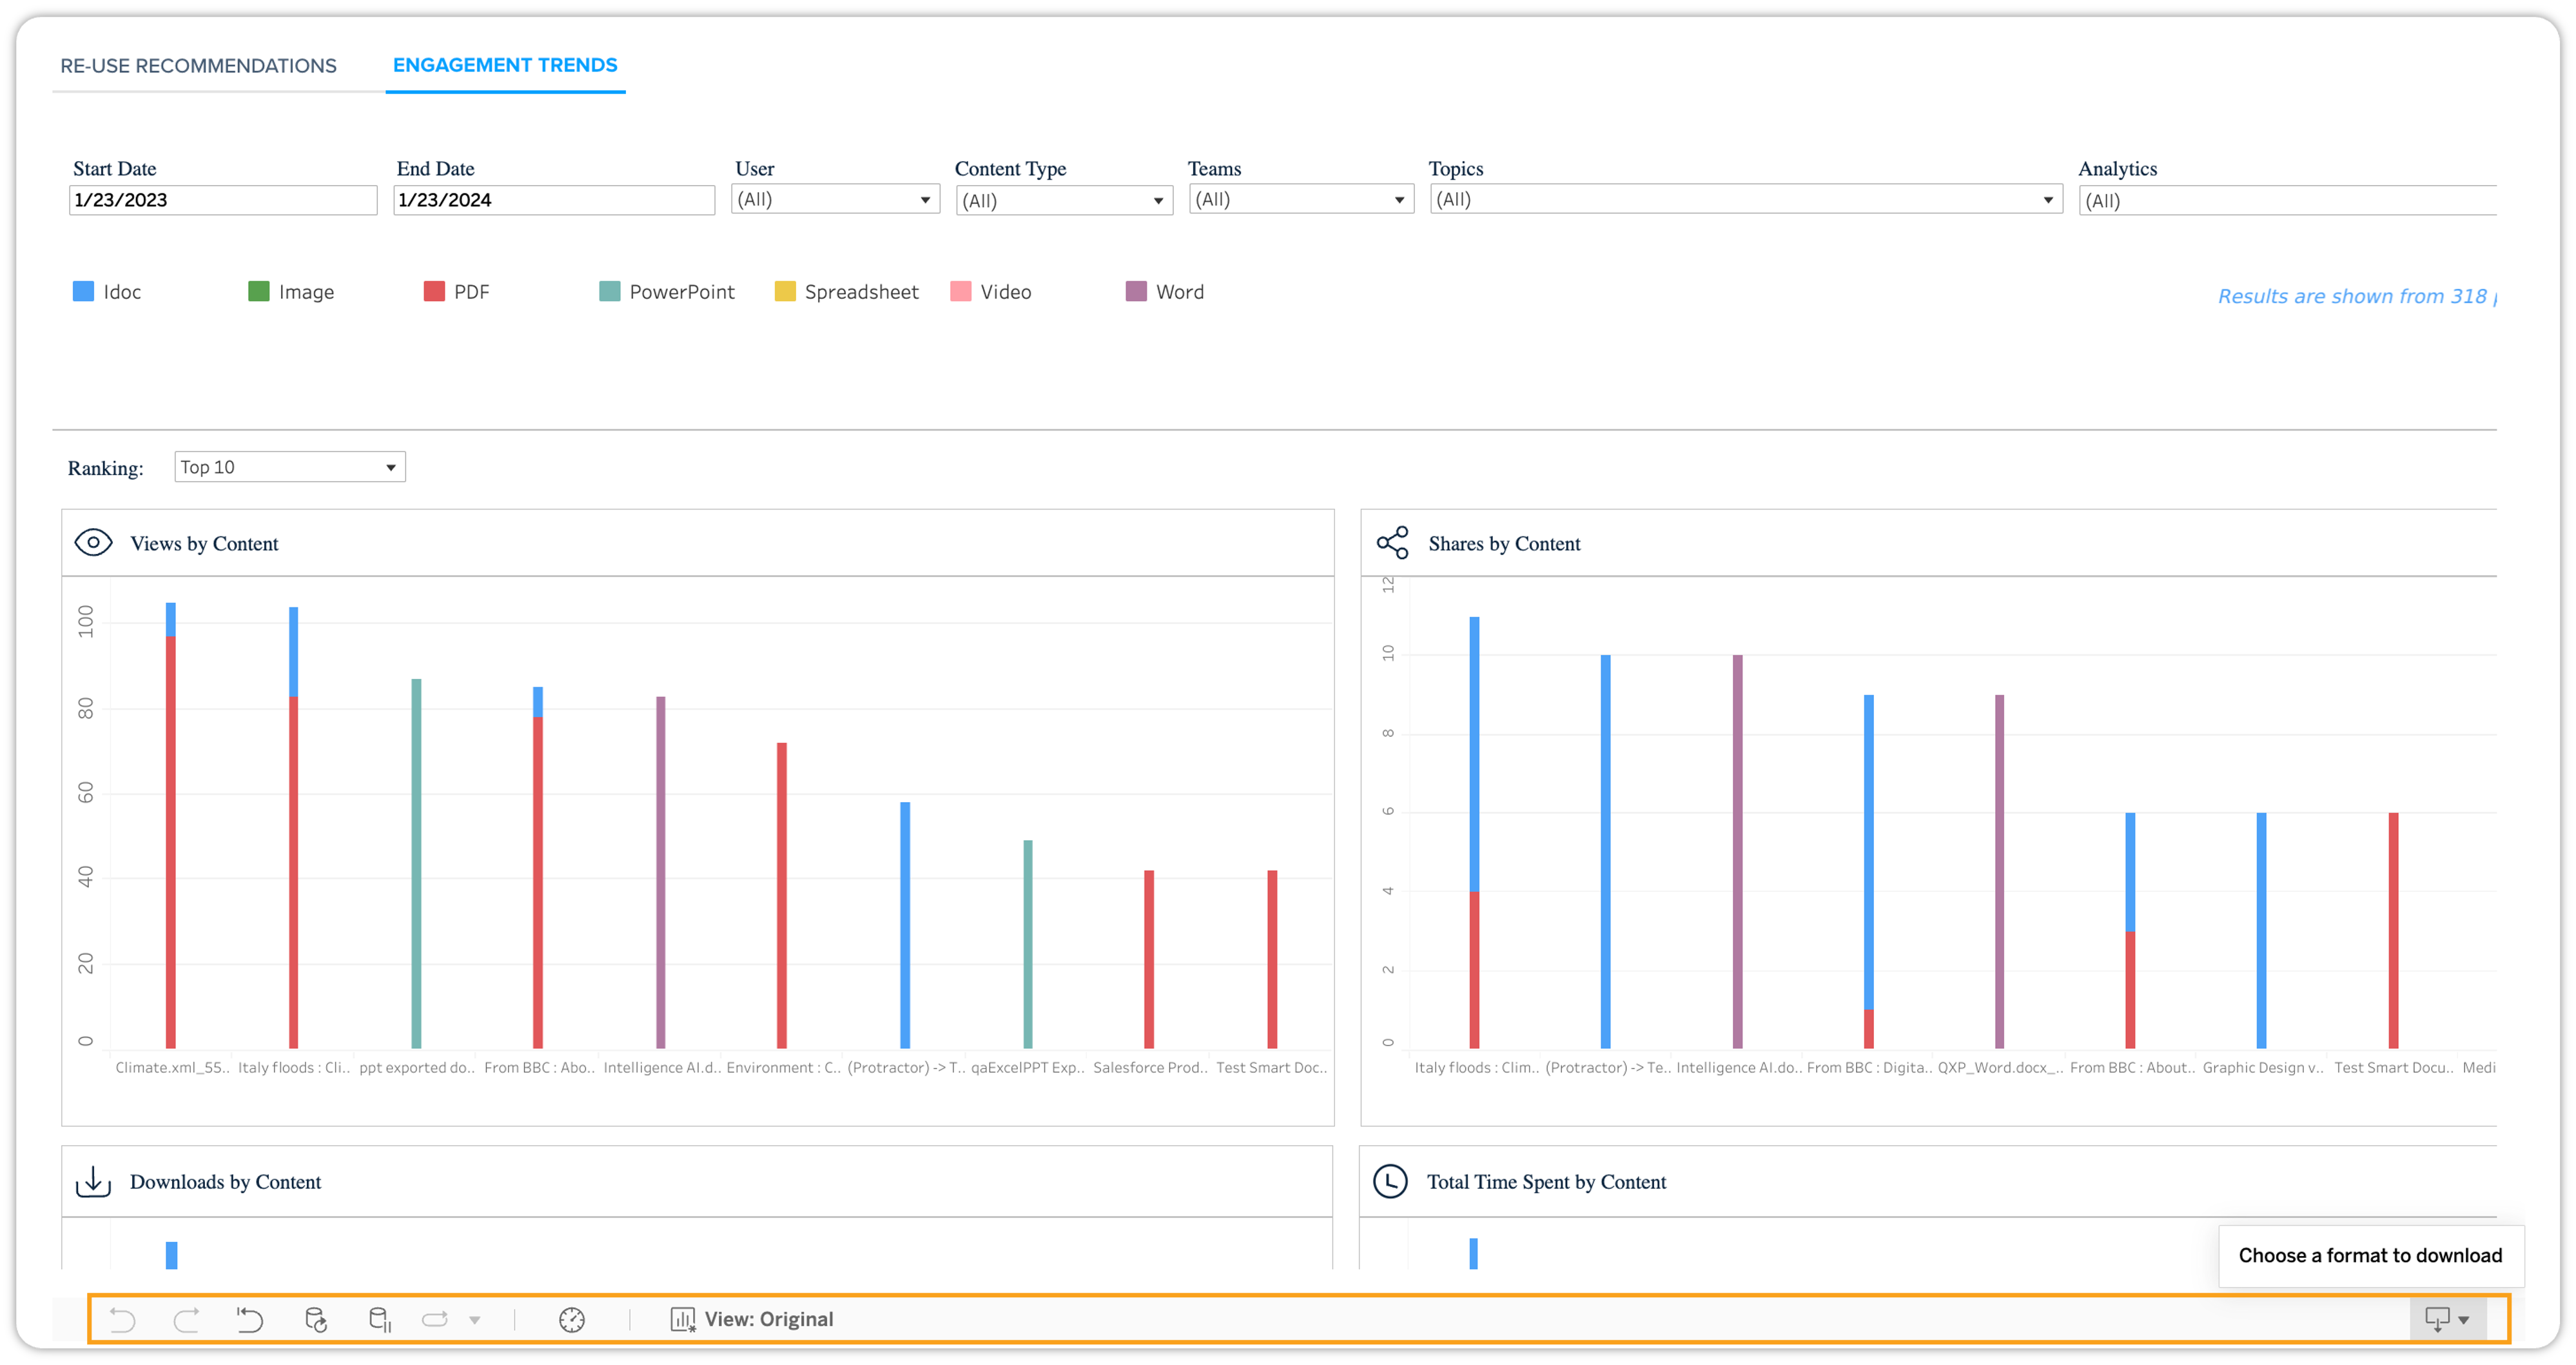
Additionally, the Engagement Trends dashboard contains the following actions at the bottom to help you view, analyze, and share important statistics in a hassle-free way –
-
Undo: Allows you to undo your last filter selection or a selection you made on any of the interactive graphs within an analytics tab.
-
Redo: Allows you to redo your last filter selection or a selection you did on any of the interactive graphs within an analytics tab and then undid.
-
Reset View: Allows you to reset the view of filter and chart selections to the previous state.
-
Refresh: Allows you to refresh the statistics to reflect the most recent changes that might have taken place after you opened the current analytics page.
-
Pause: Allows you to pause a filtered search or refresh to retain the current state of analytics.
-
View Original: Allows you to manage the default view for an analytic. For example, set the default view with certain filters applied. You can manage the views through the Custom View dialog.
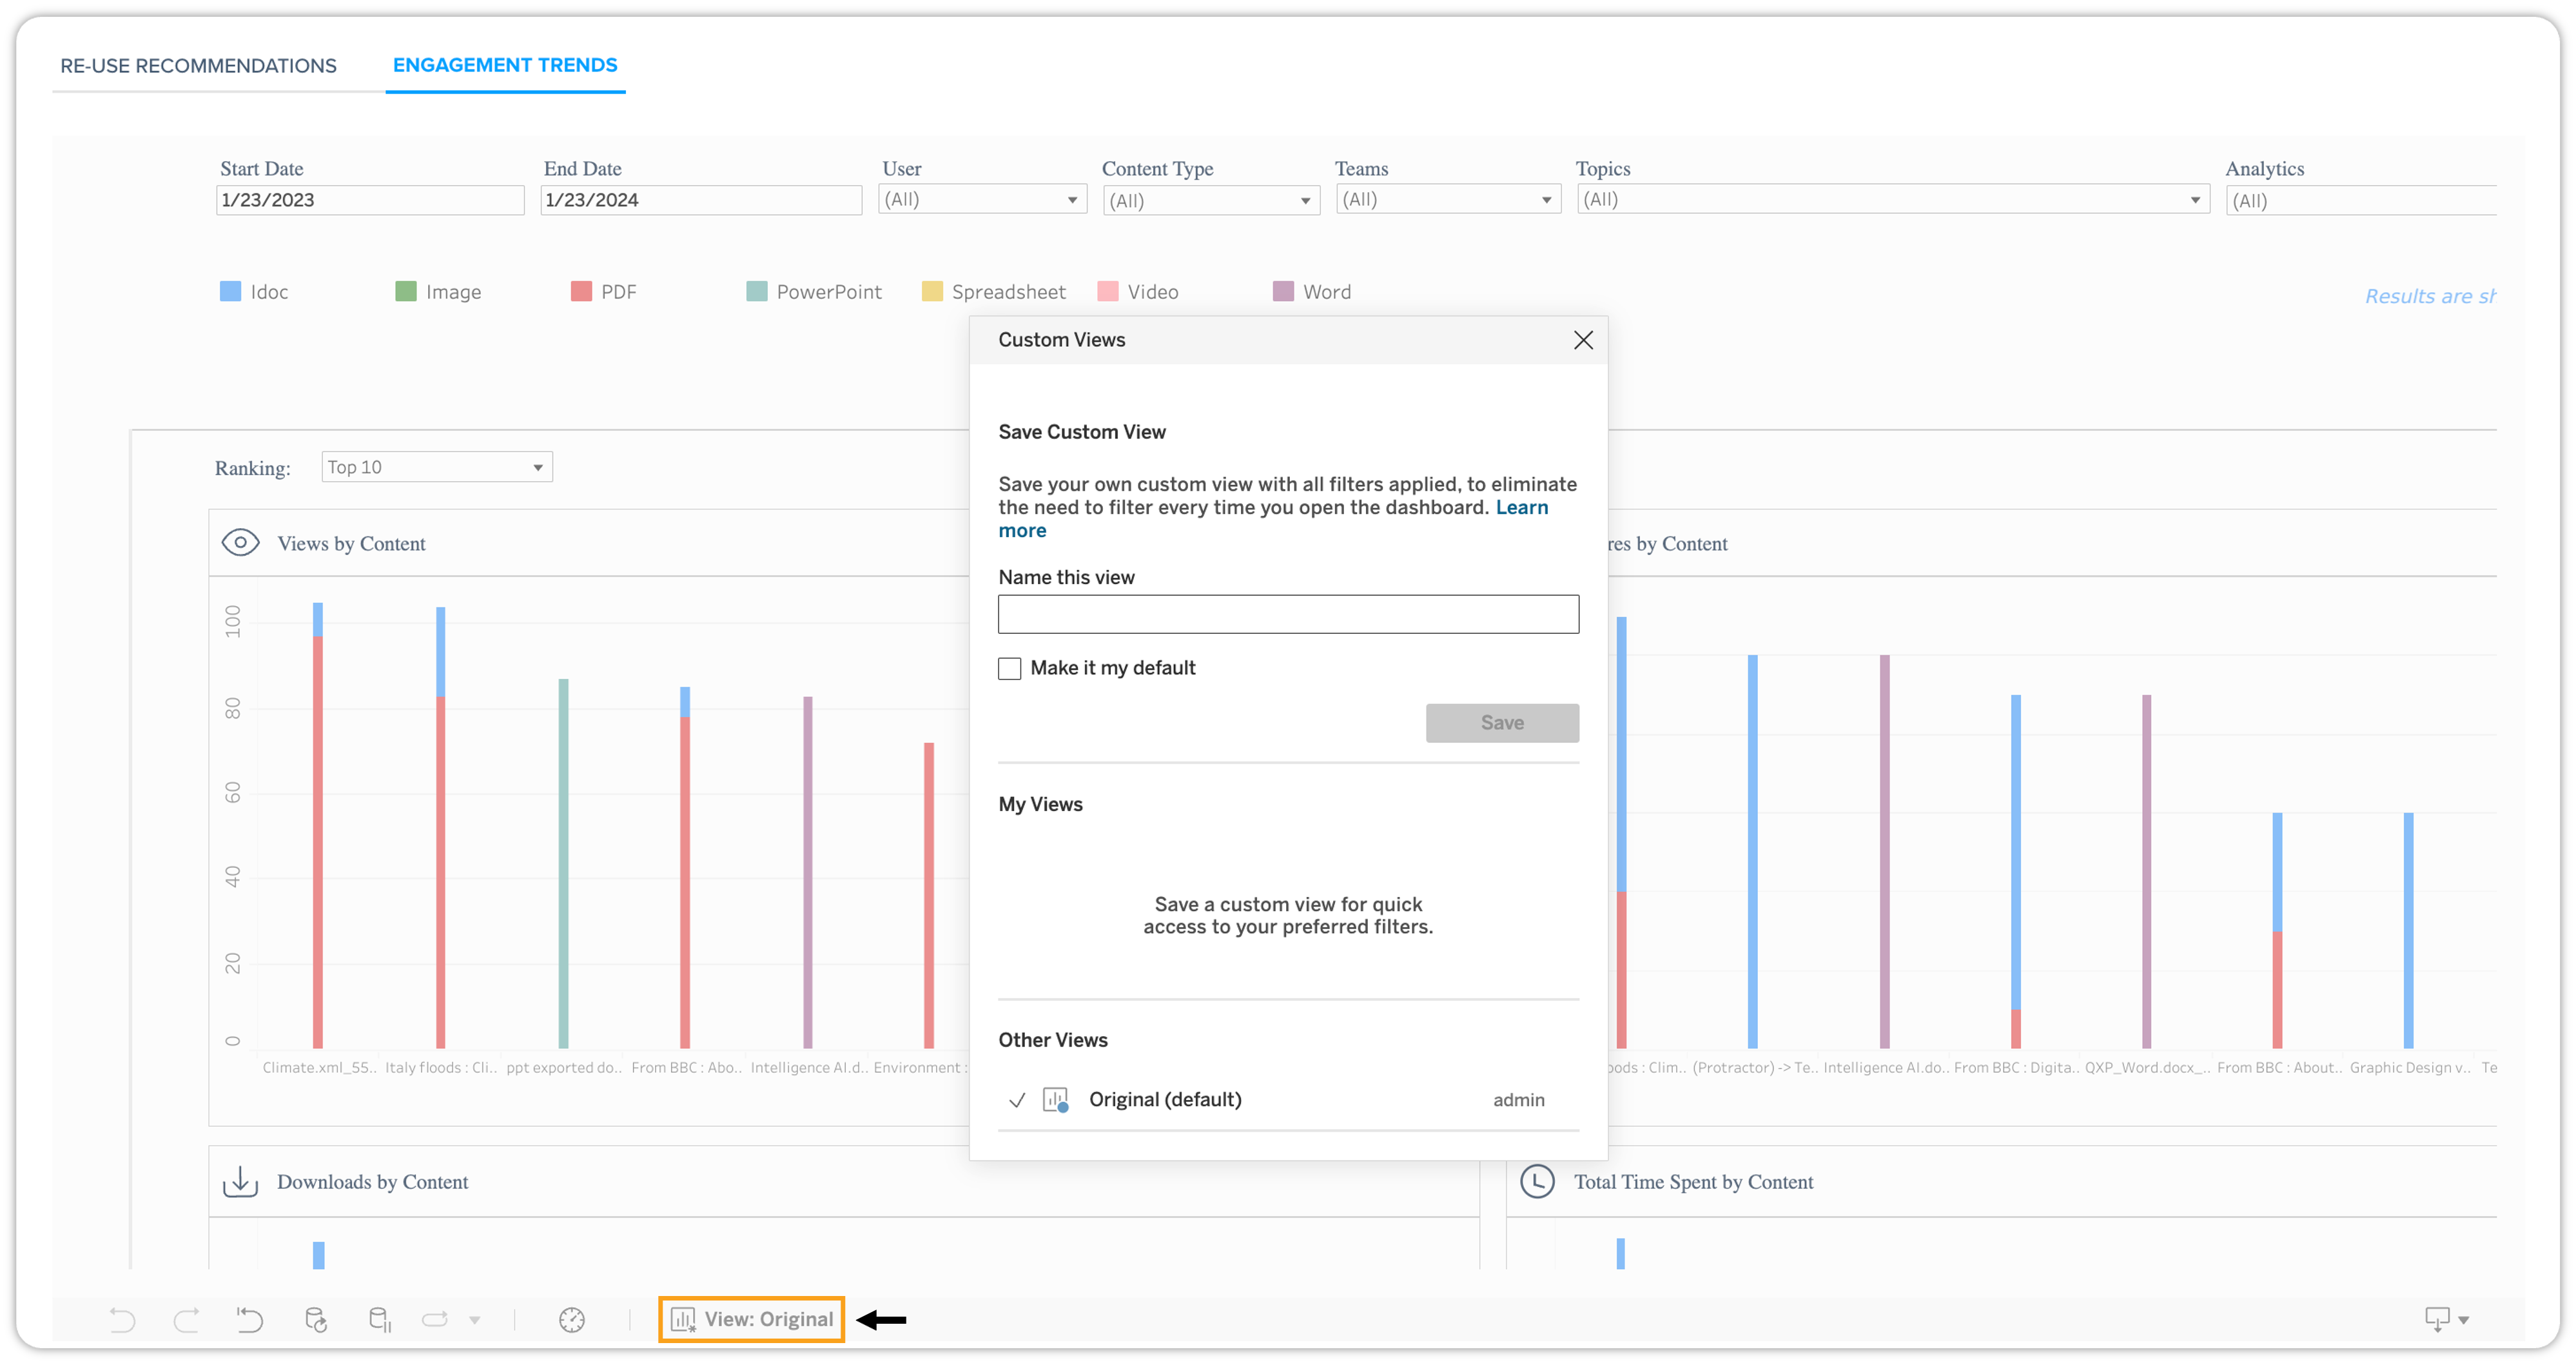
-
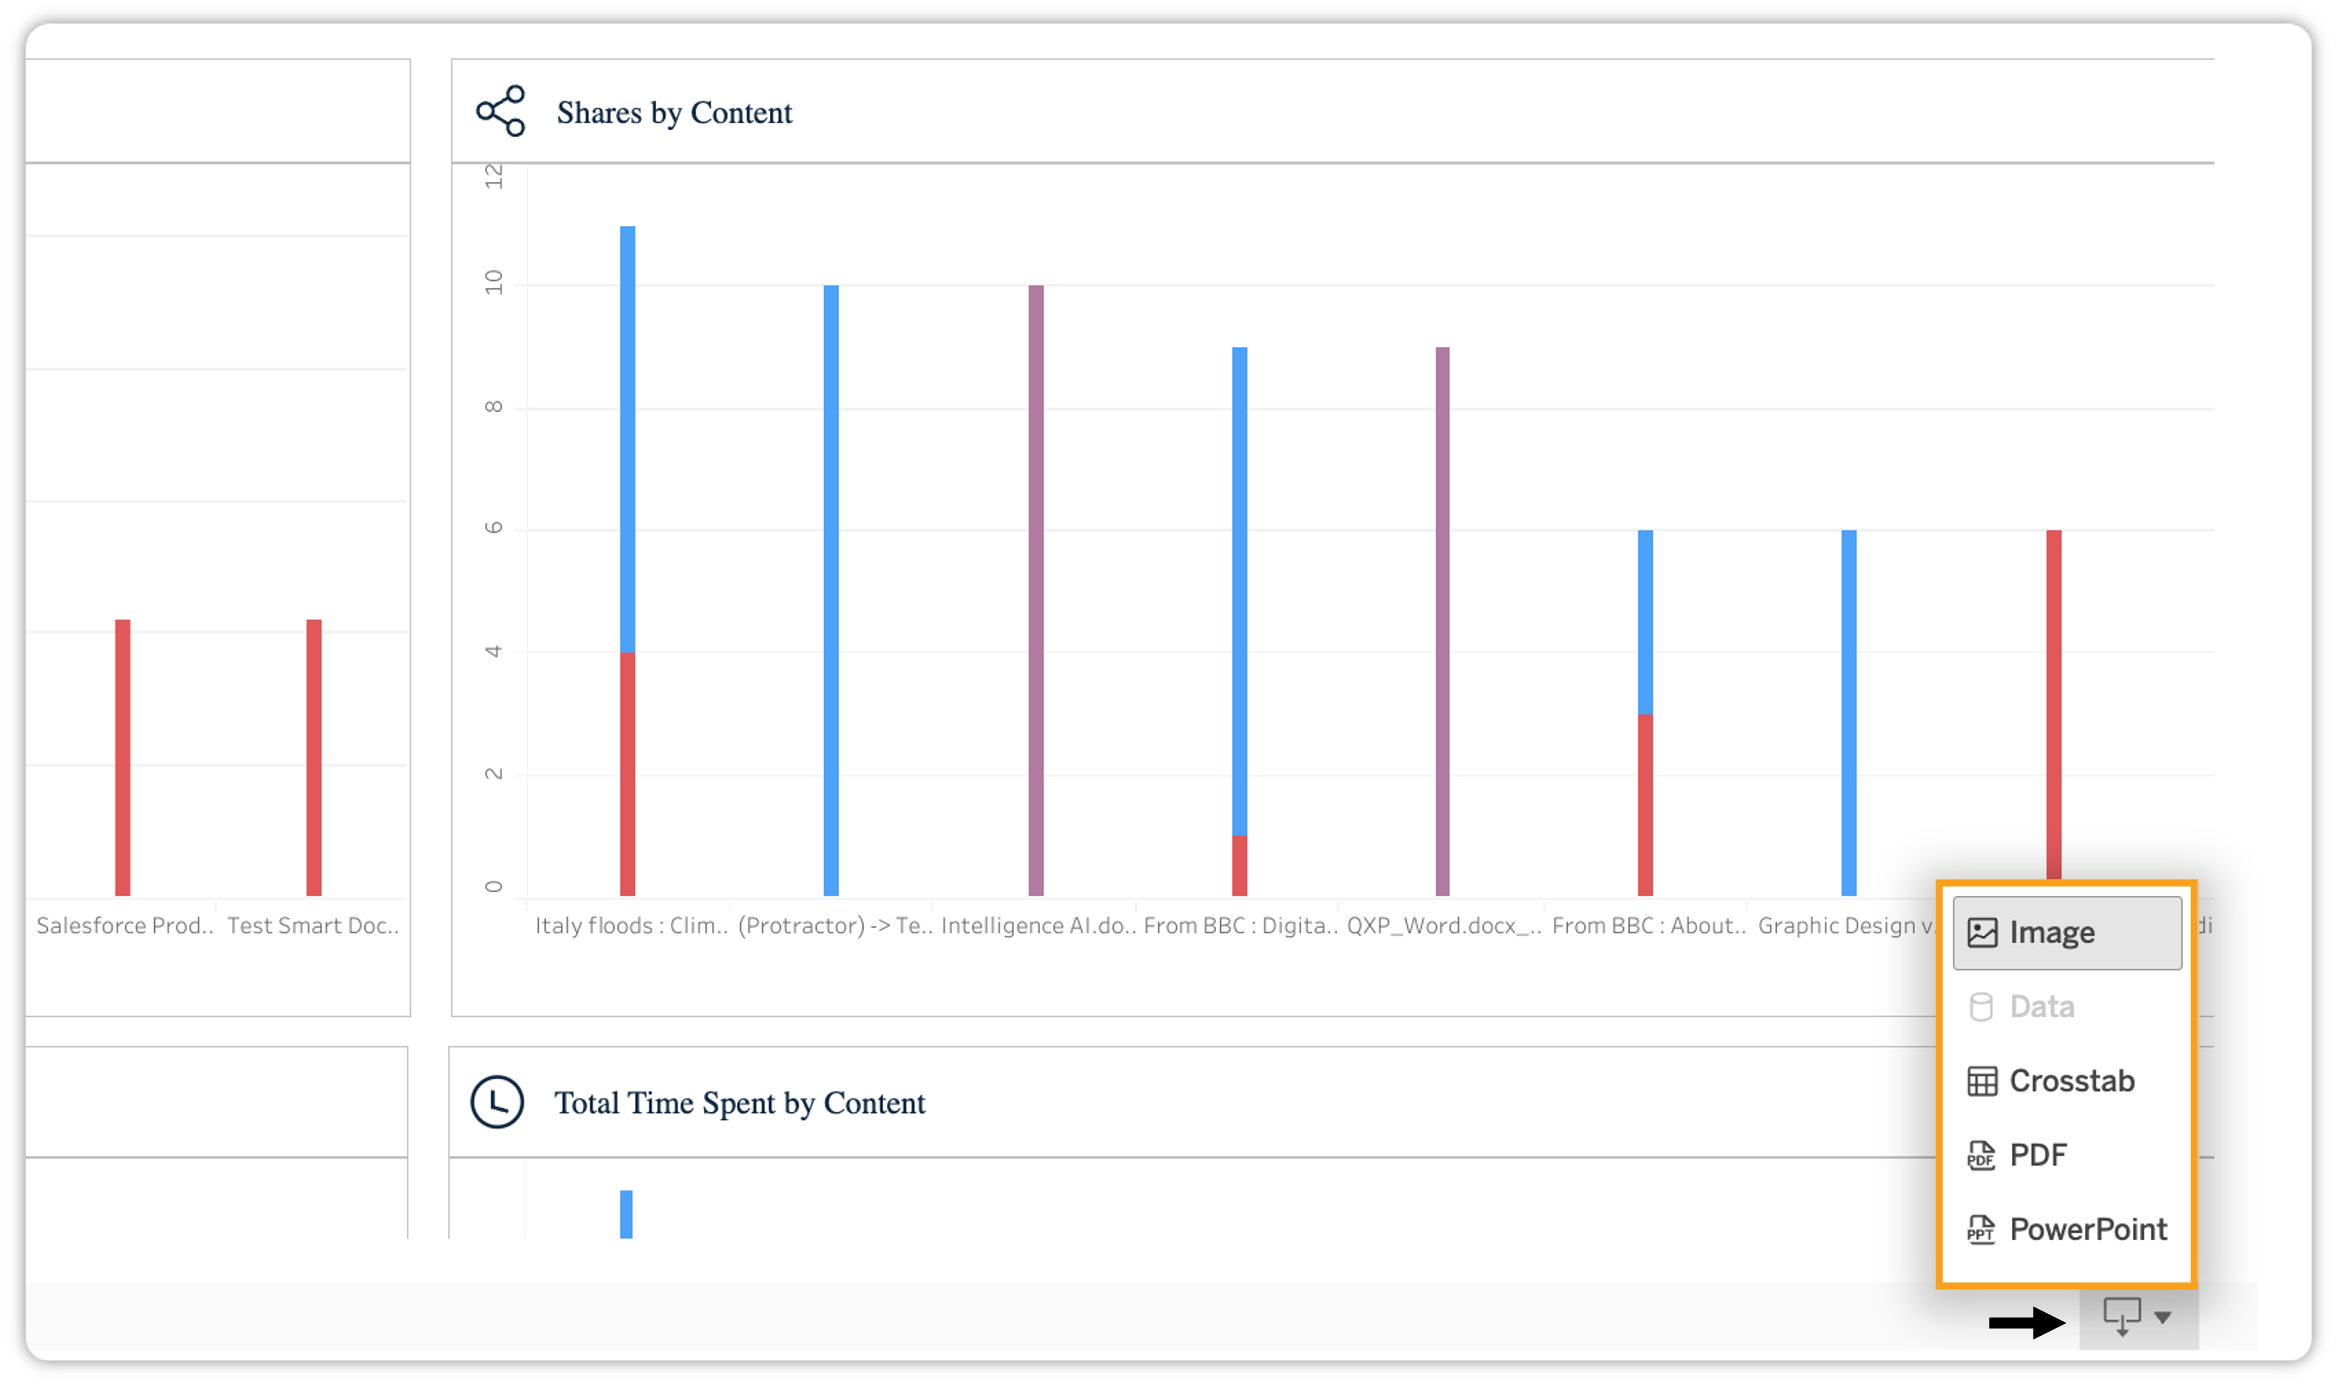
Download: Allows you to download the current analytics in different file formats: Image (PNG), Crosstab, PDF, and PowerPoint.