
Content Operations
The Content Operations tab is designed to help you manage the production, delivery, and performance of your content efficiently. It has three different dashboards –
Production Trends
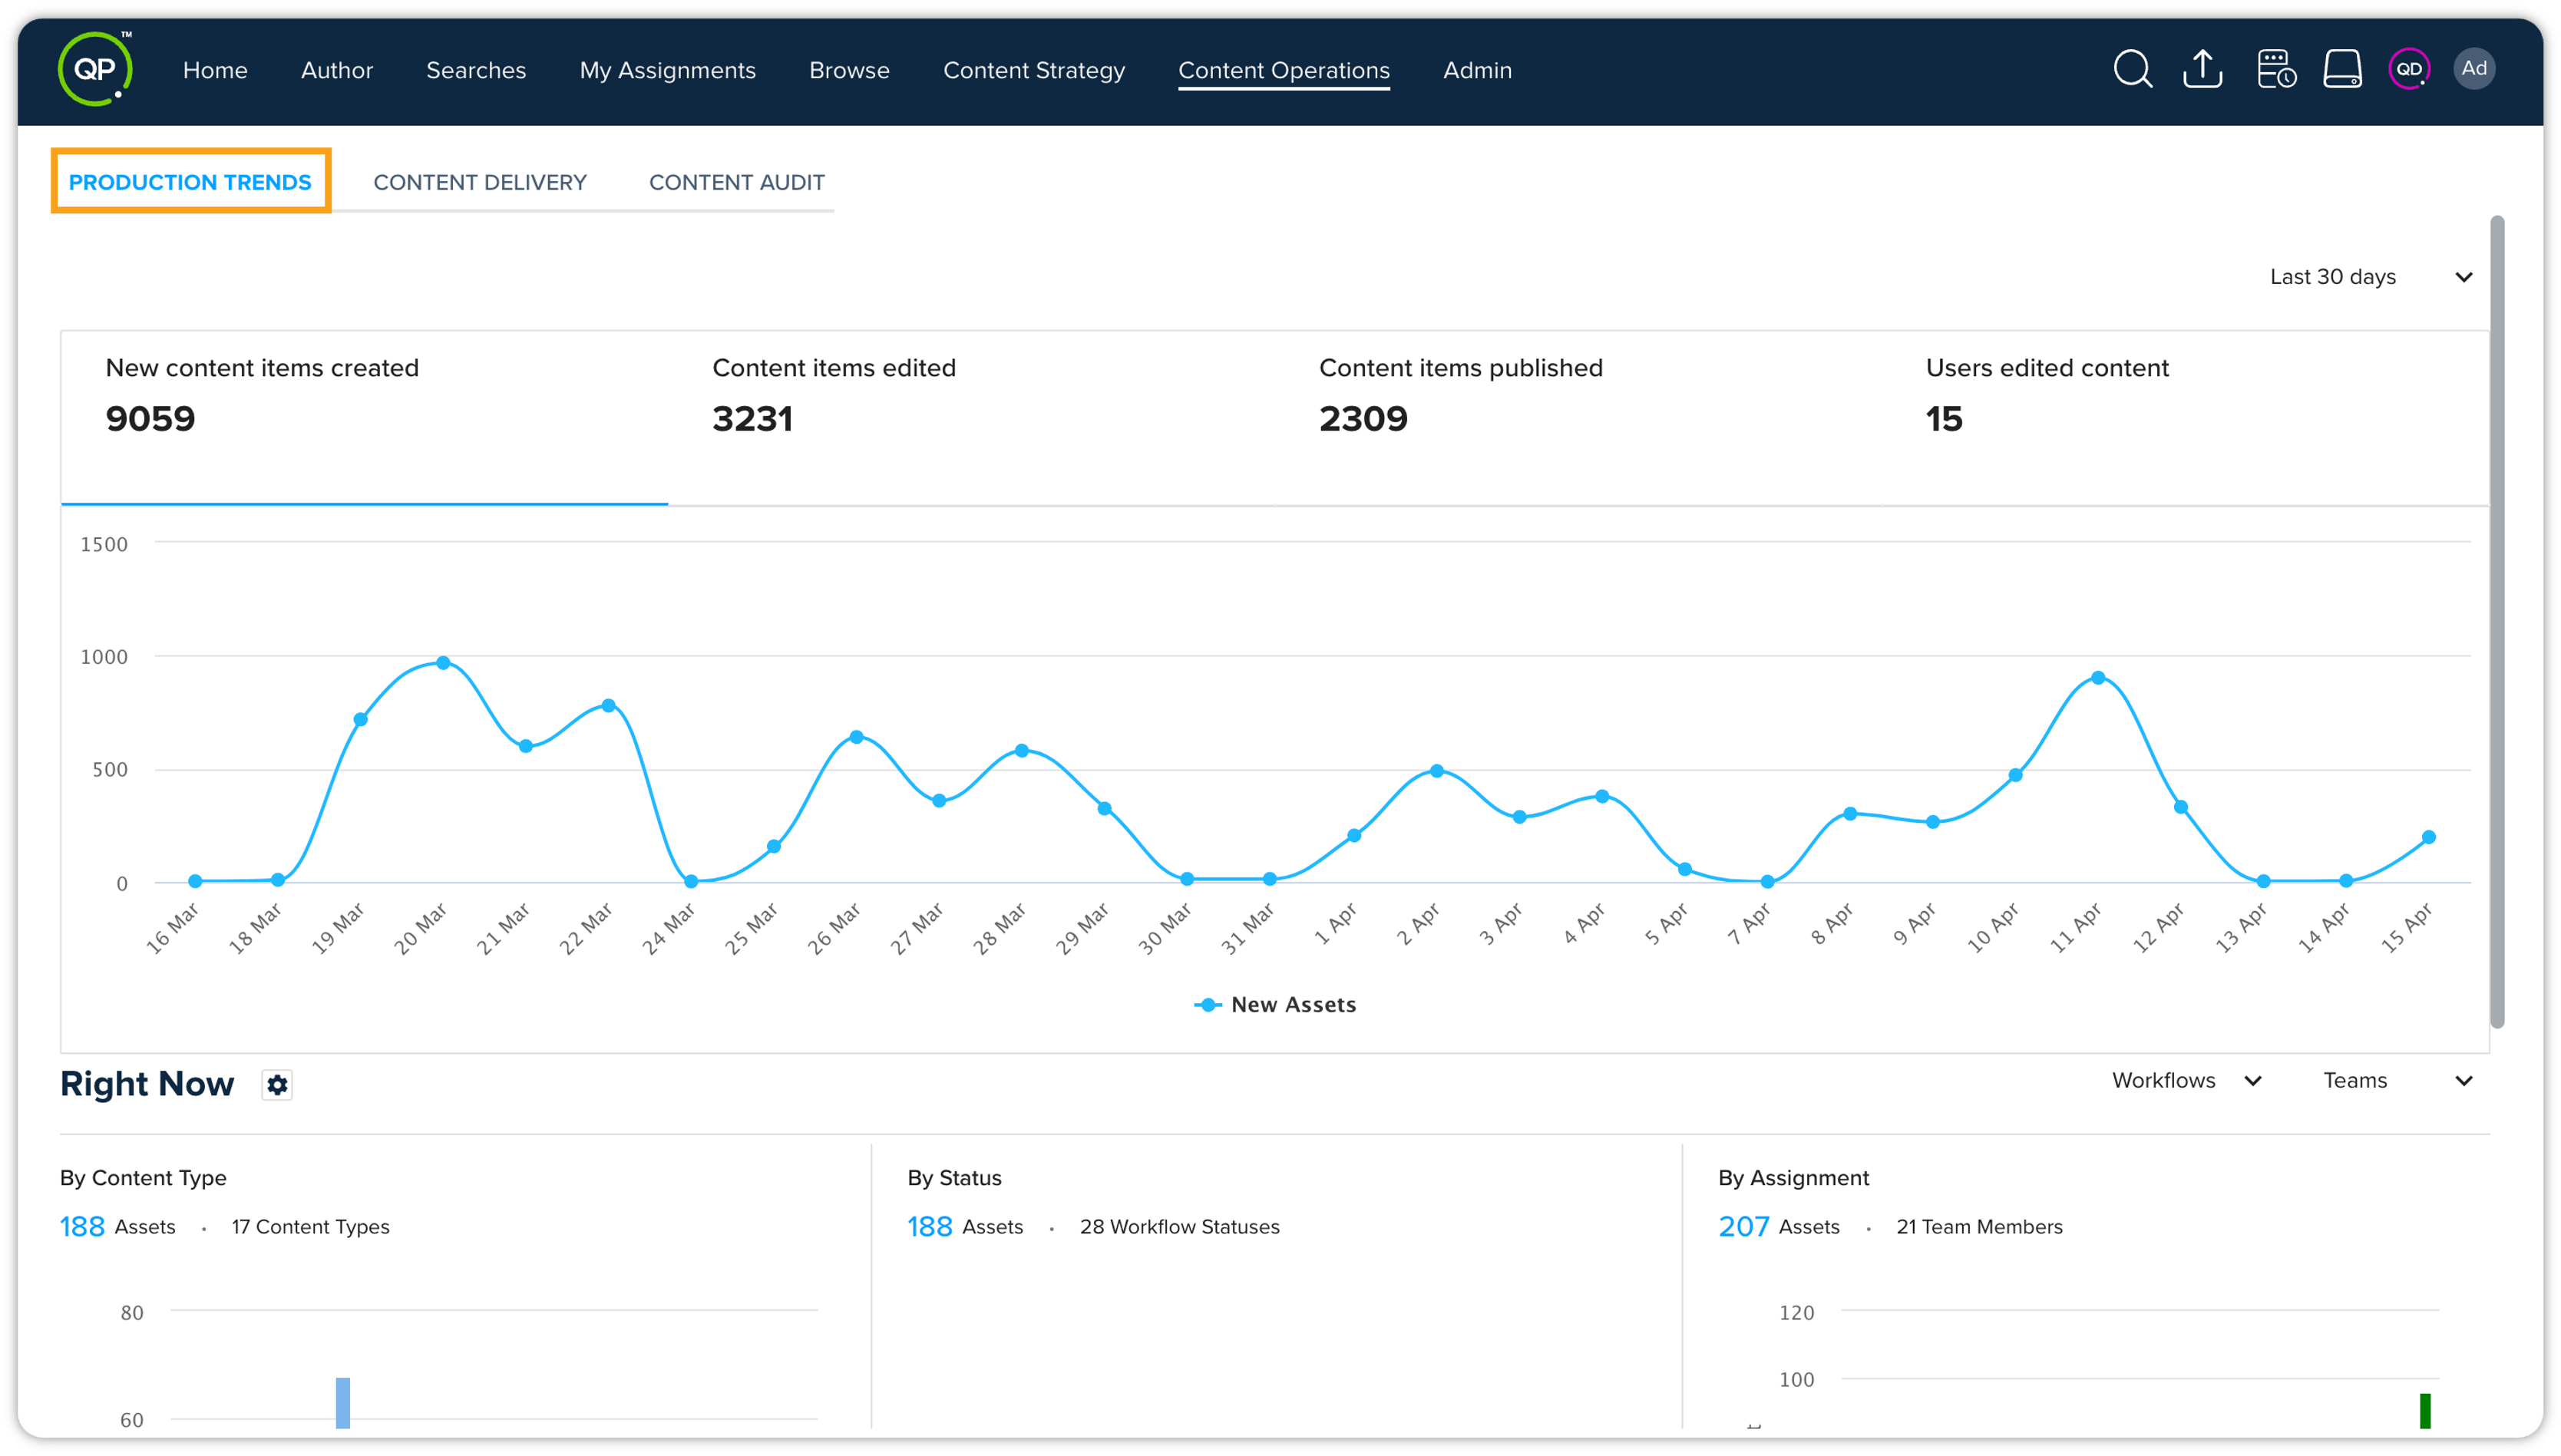
The Production Trends report displays the number of assets created, published, and edited over a period in the form of line graphs. These statistics are as follows –
-
New content items created
-
Content items edited
-
Content items published
-
Users edited content (the number of users involved in editing all the edited content items in a period)
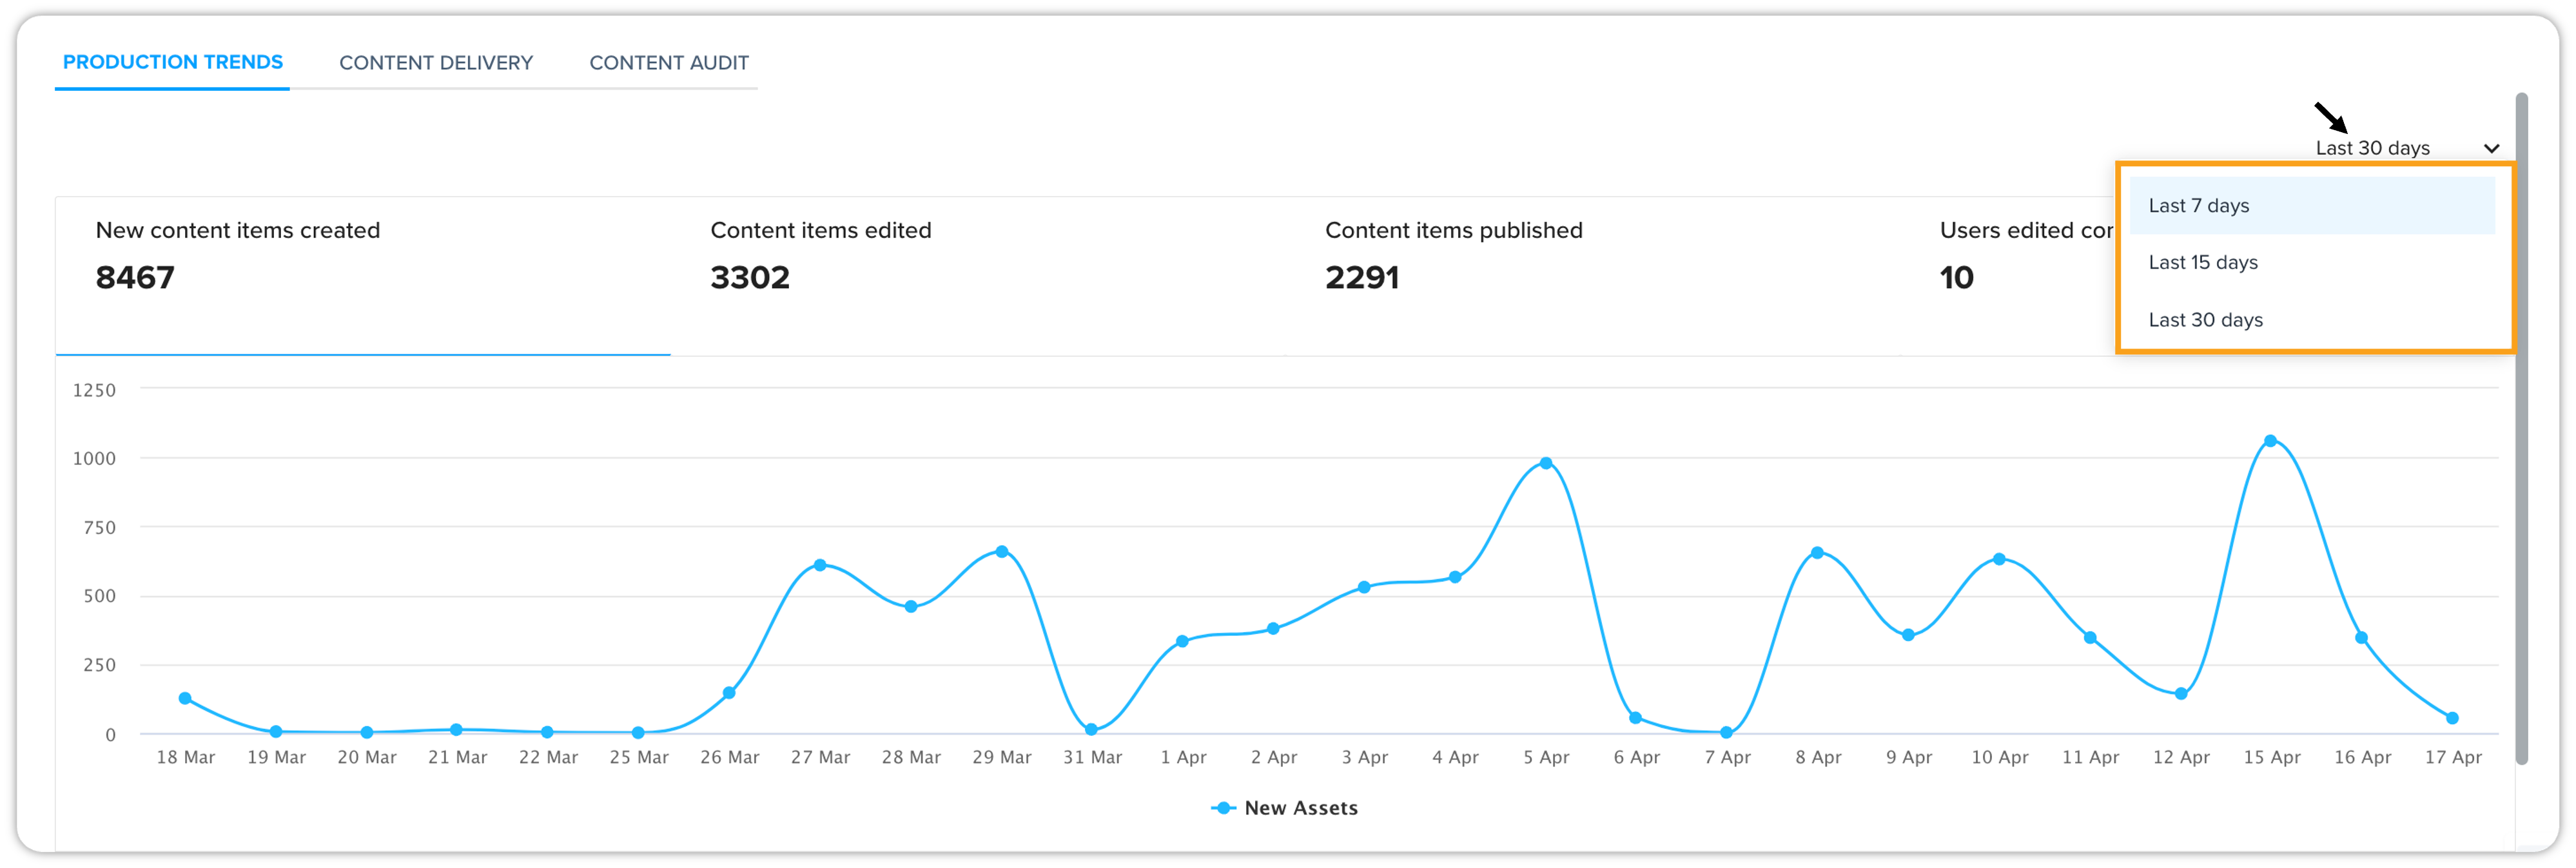
You can also select a period to see the statistics for that period through a dropdown menu in the top right corner of the Production Trends dashboard.
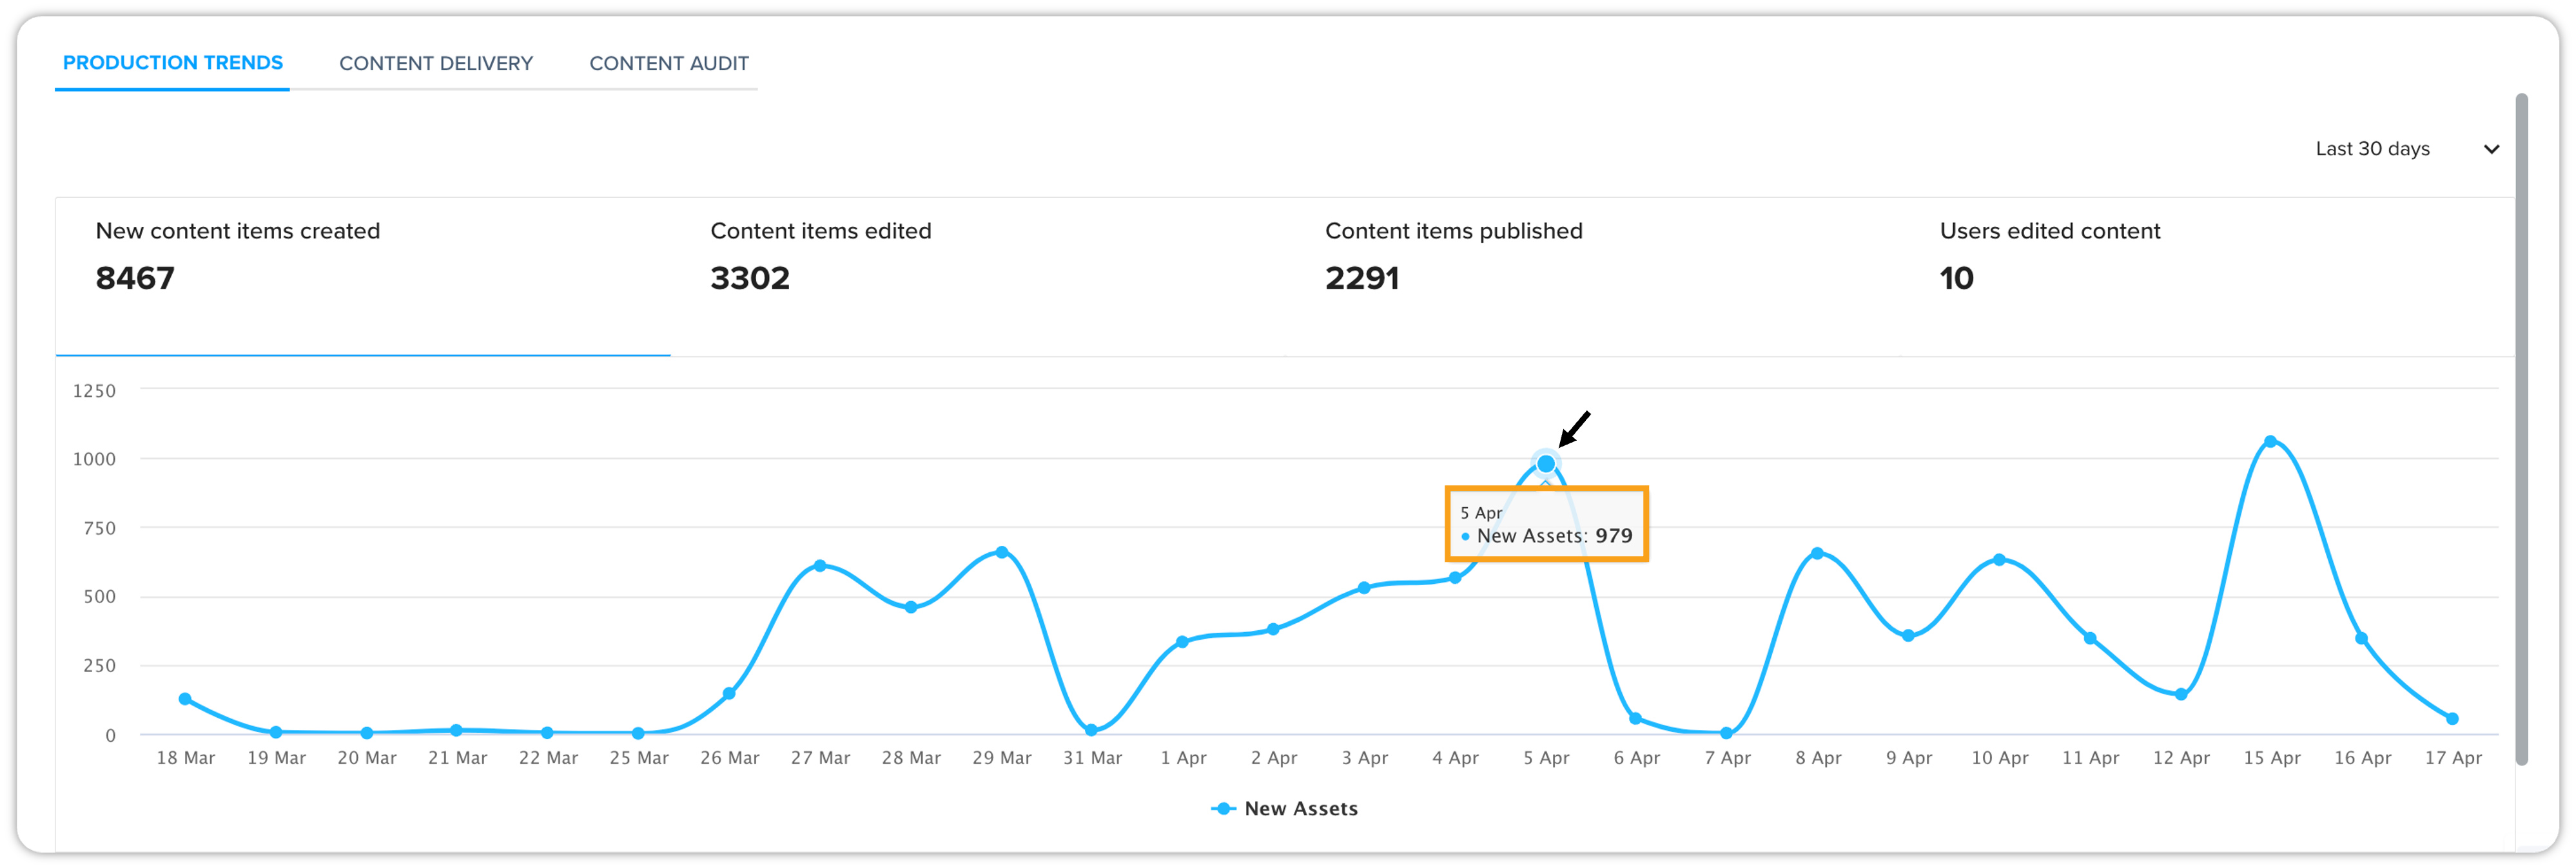
Additionally, you can hover over the line graph to see the exact count for a day.
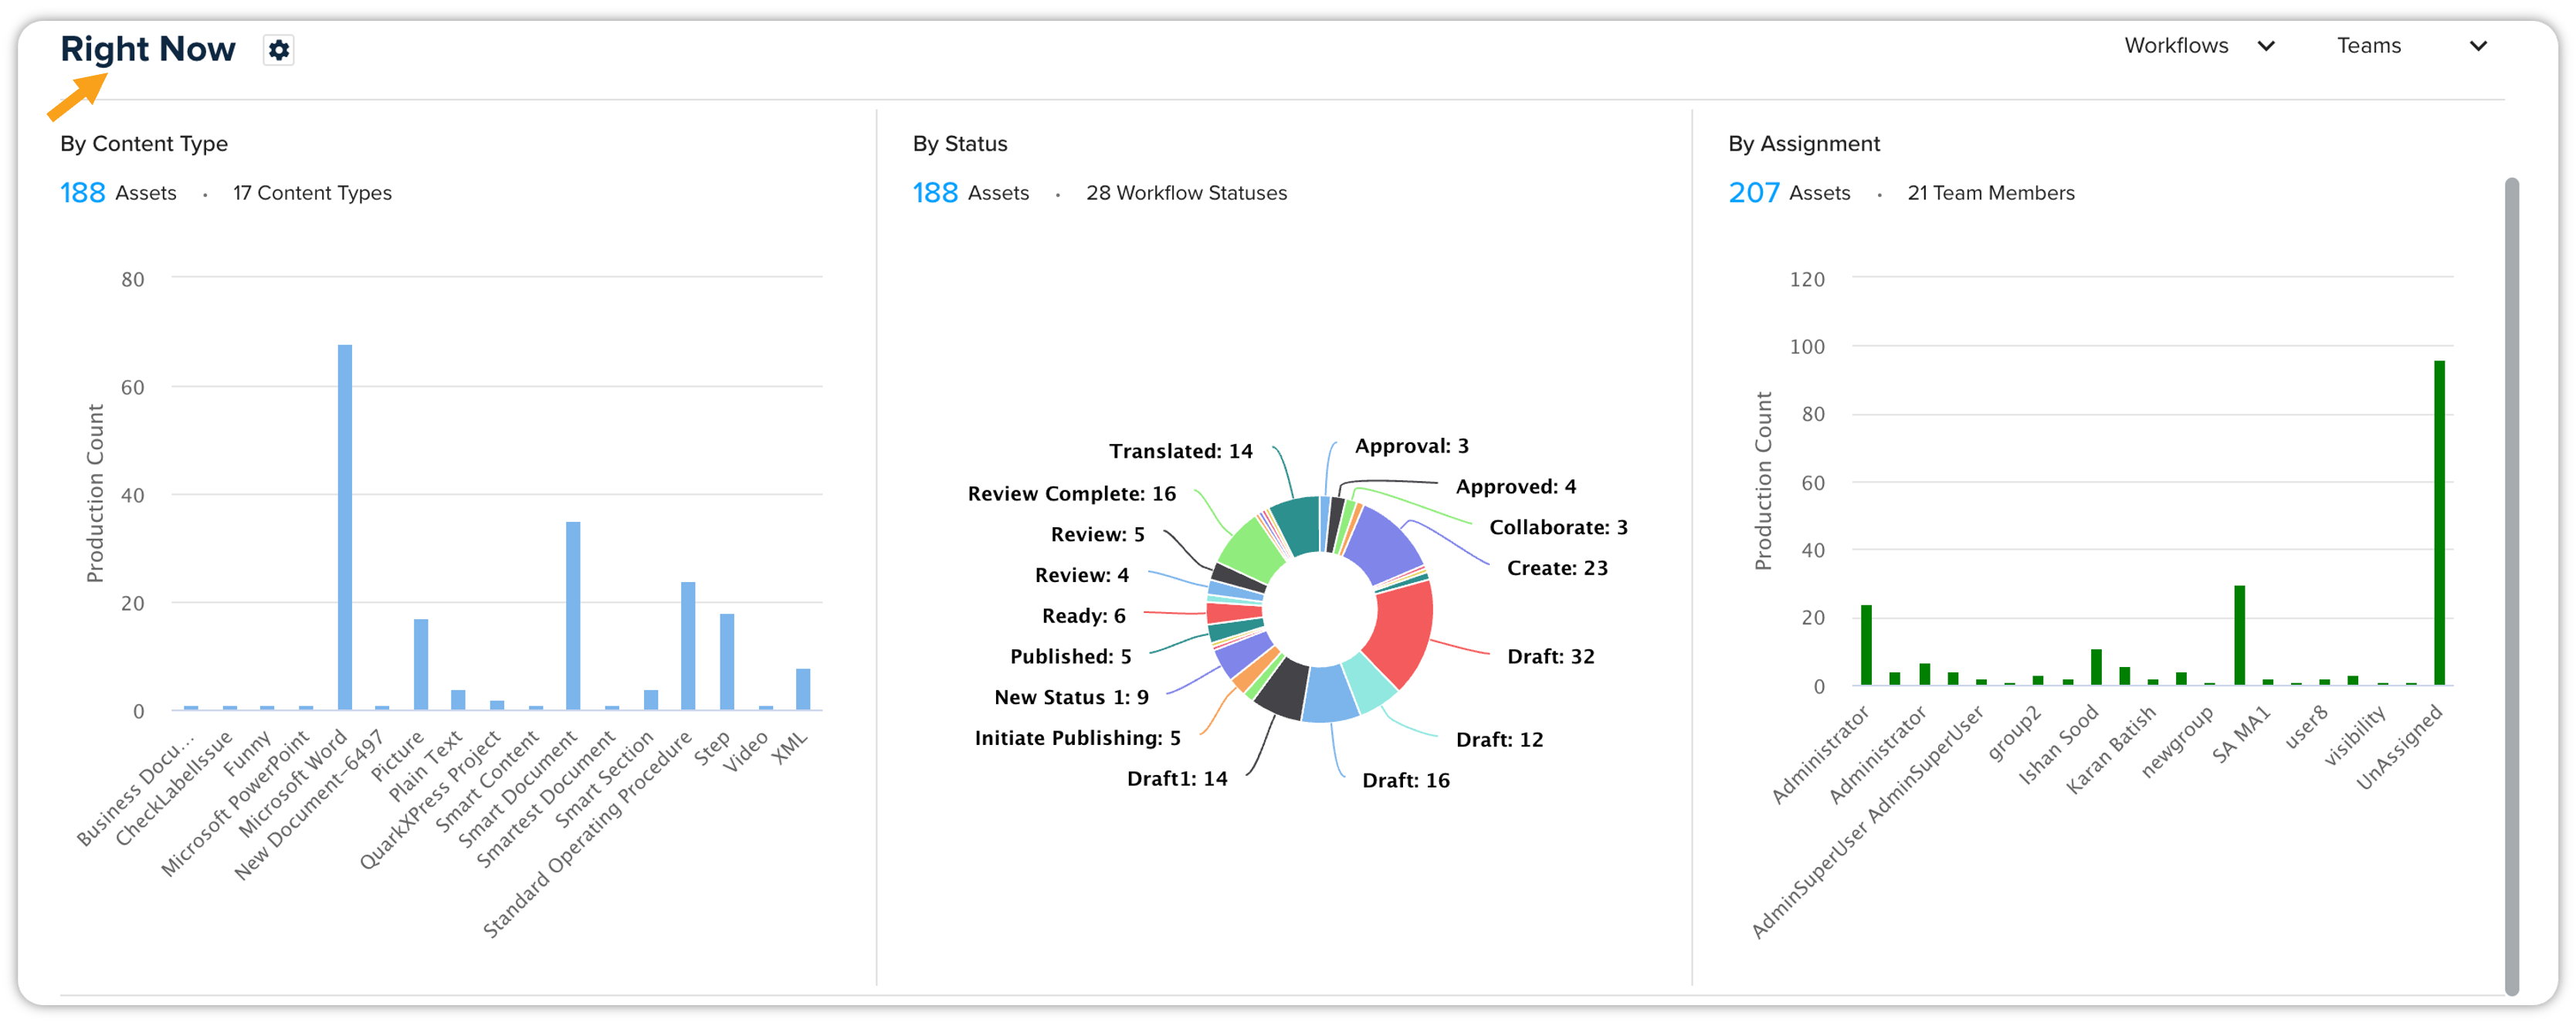
Right Now
The Right Now section under the Production Trends tab displays the overall statistics related to assets by content type, by workflow status, and by assignment (assigned user) in the form bar and pie charts.
The Right Now section also contains several options to filter the statistics. These filter options are as follows –
Filter by search query
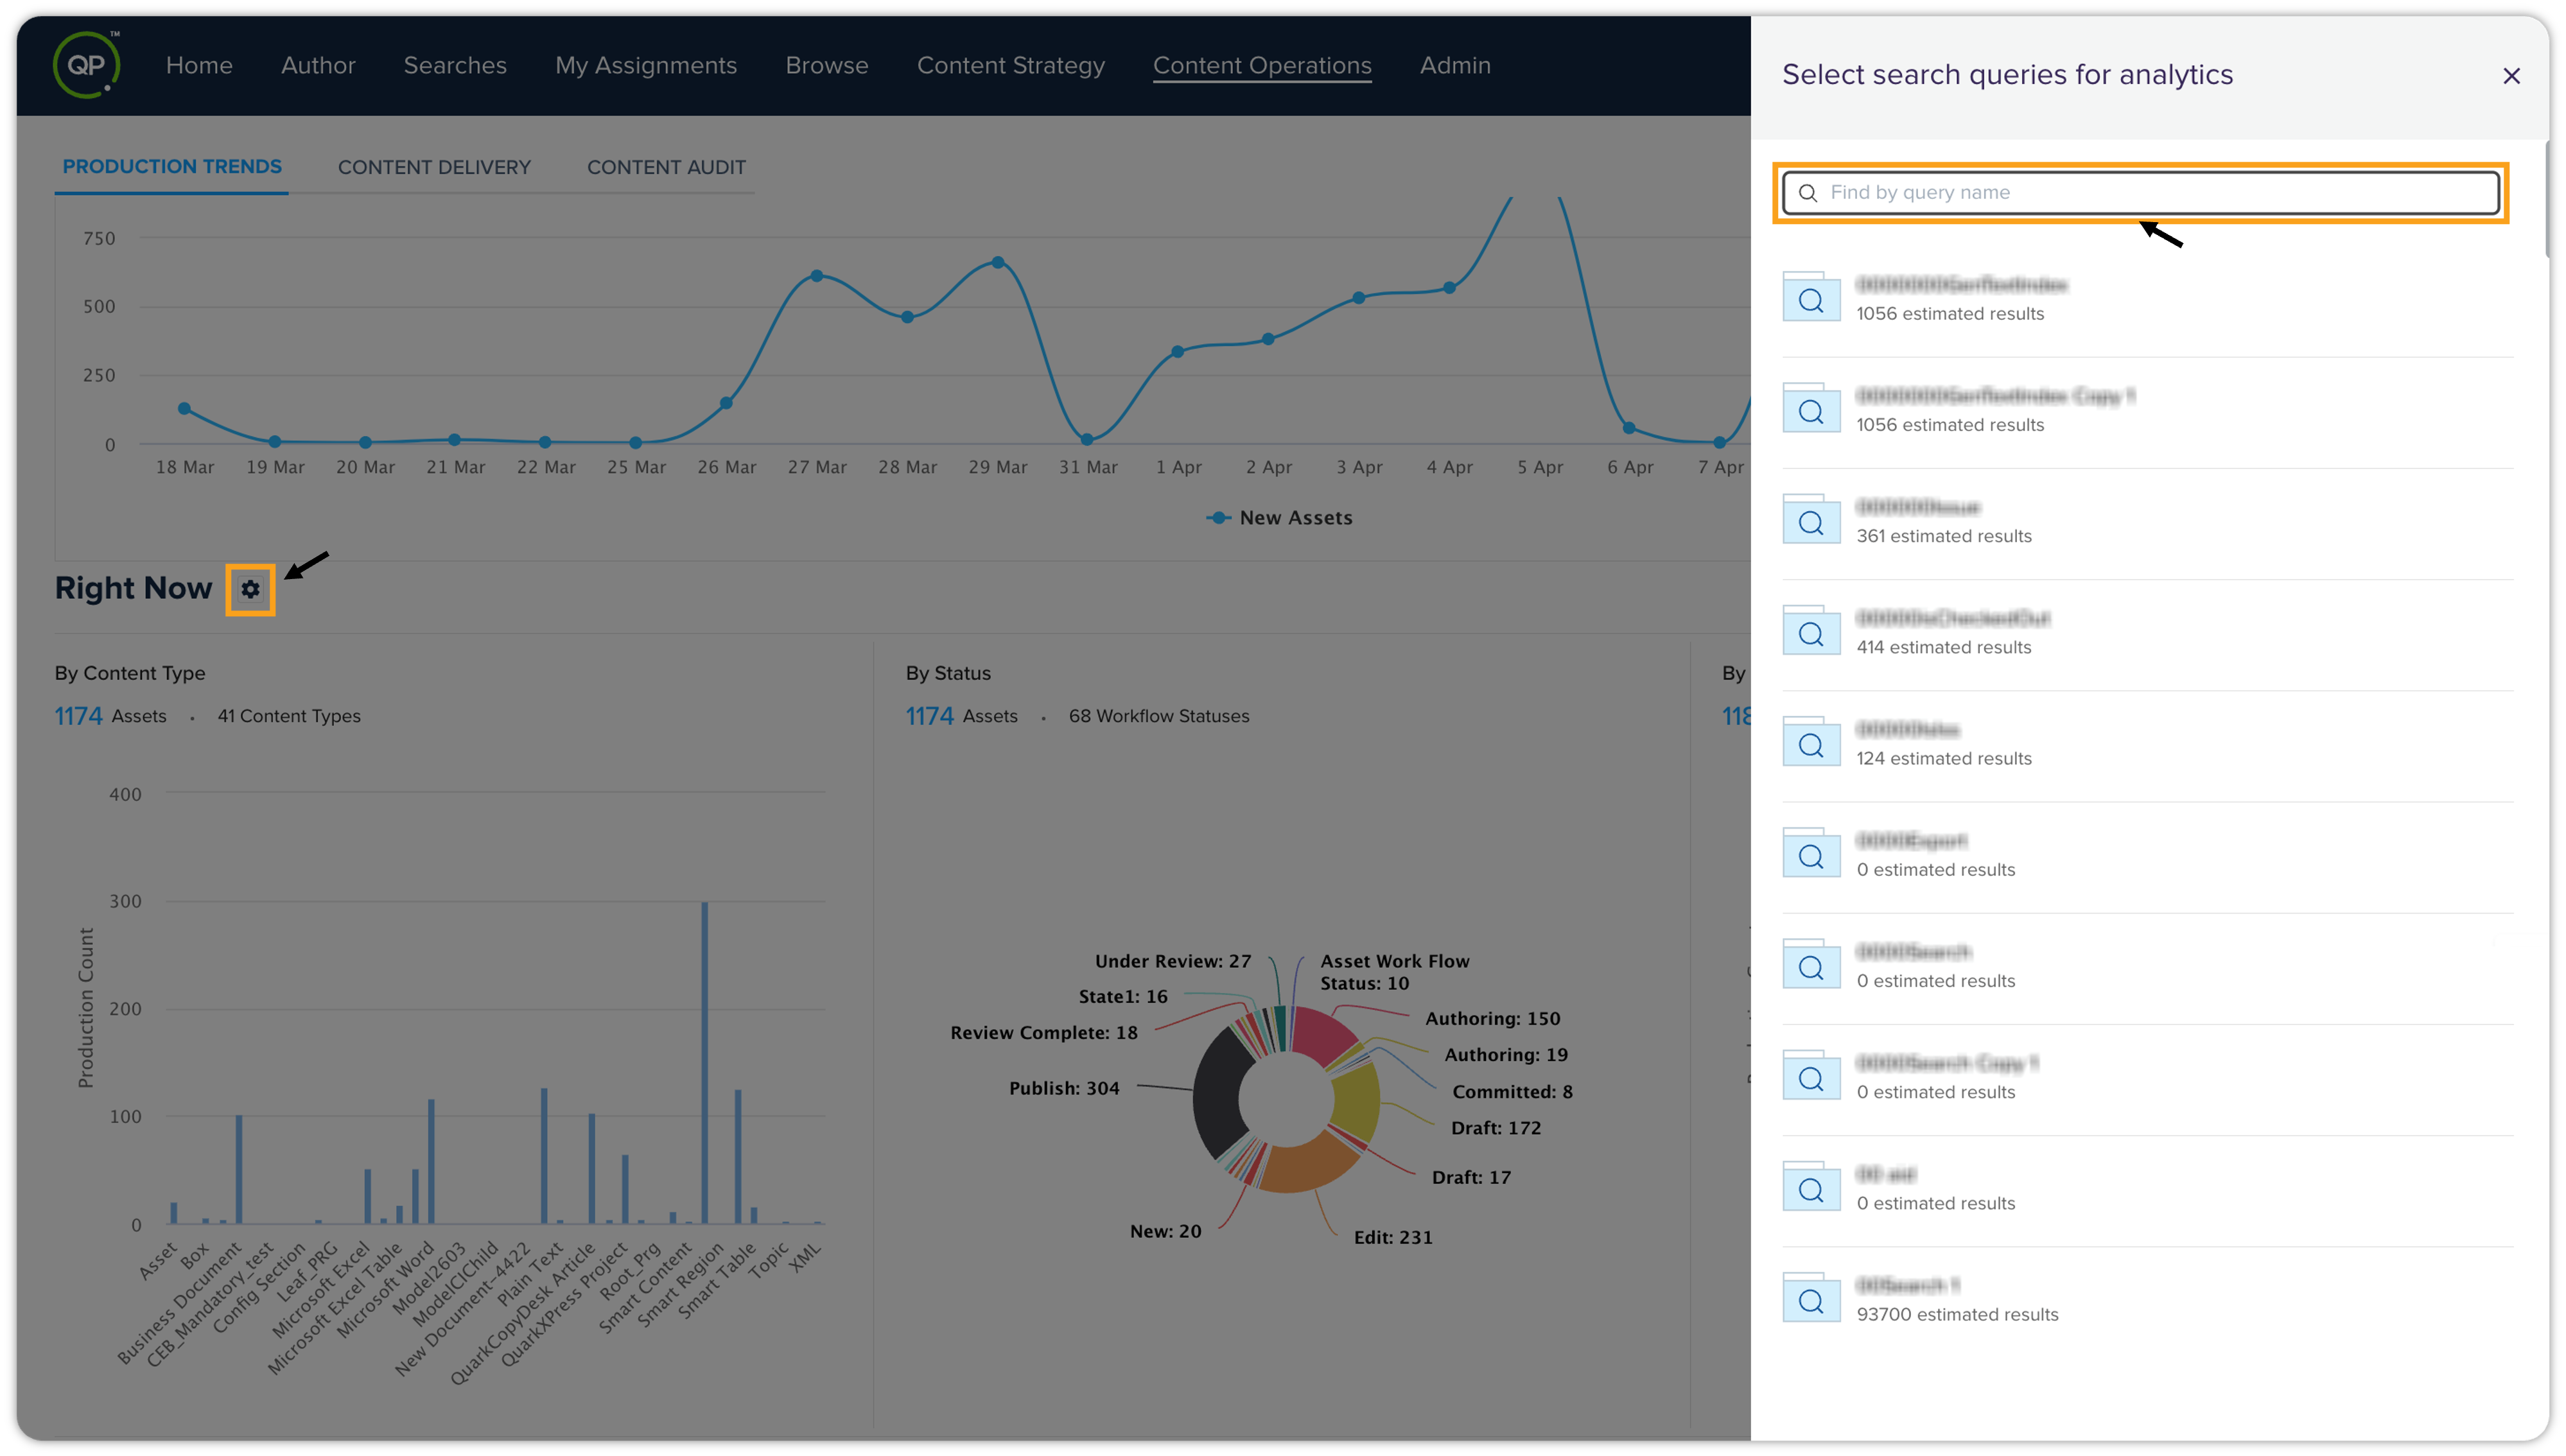
This option displays statistics related to only the results that specific search query returned. To see the statistics related to a specific search query –
-
Click on the Settings icon next to Right Now to open the list of searches in a pane at the right-hand side of the screen.
-
Select a search from the list.
-
The dashboard displays the statistics related to the assets returned by the selected search.
Filter by content type
To see the statistics for an asset type –
-
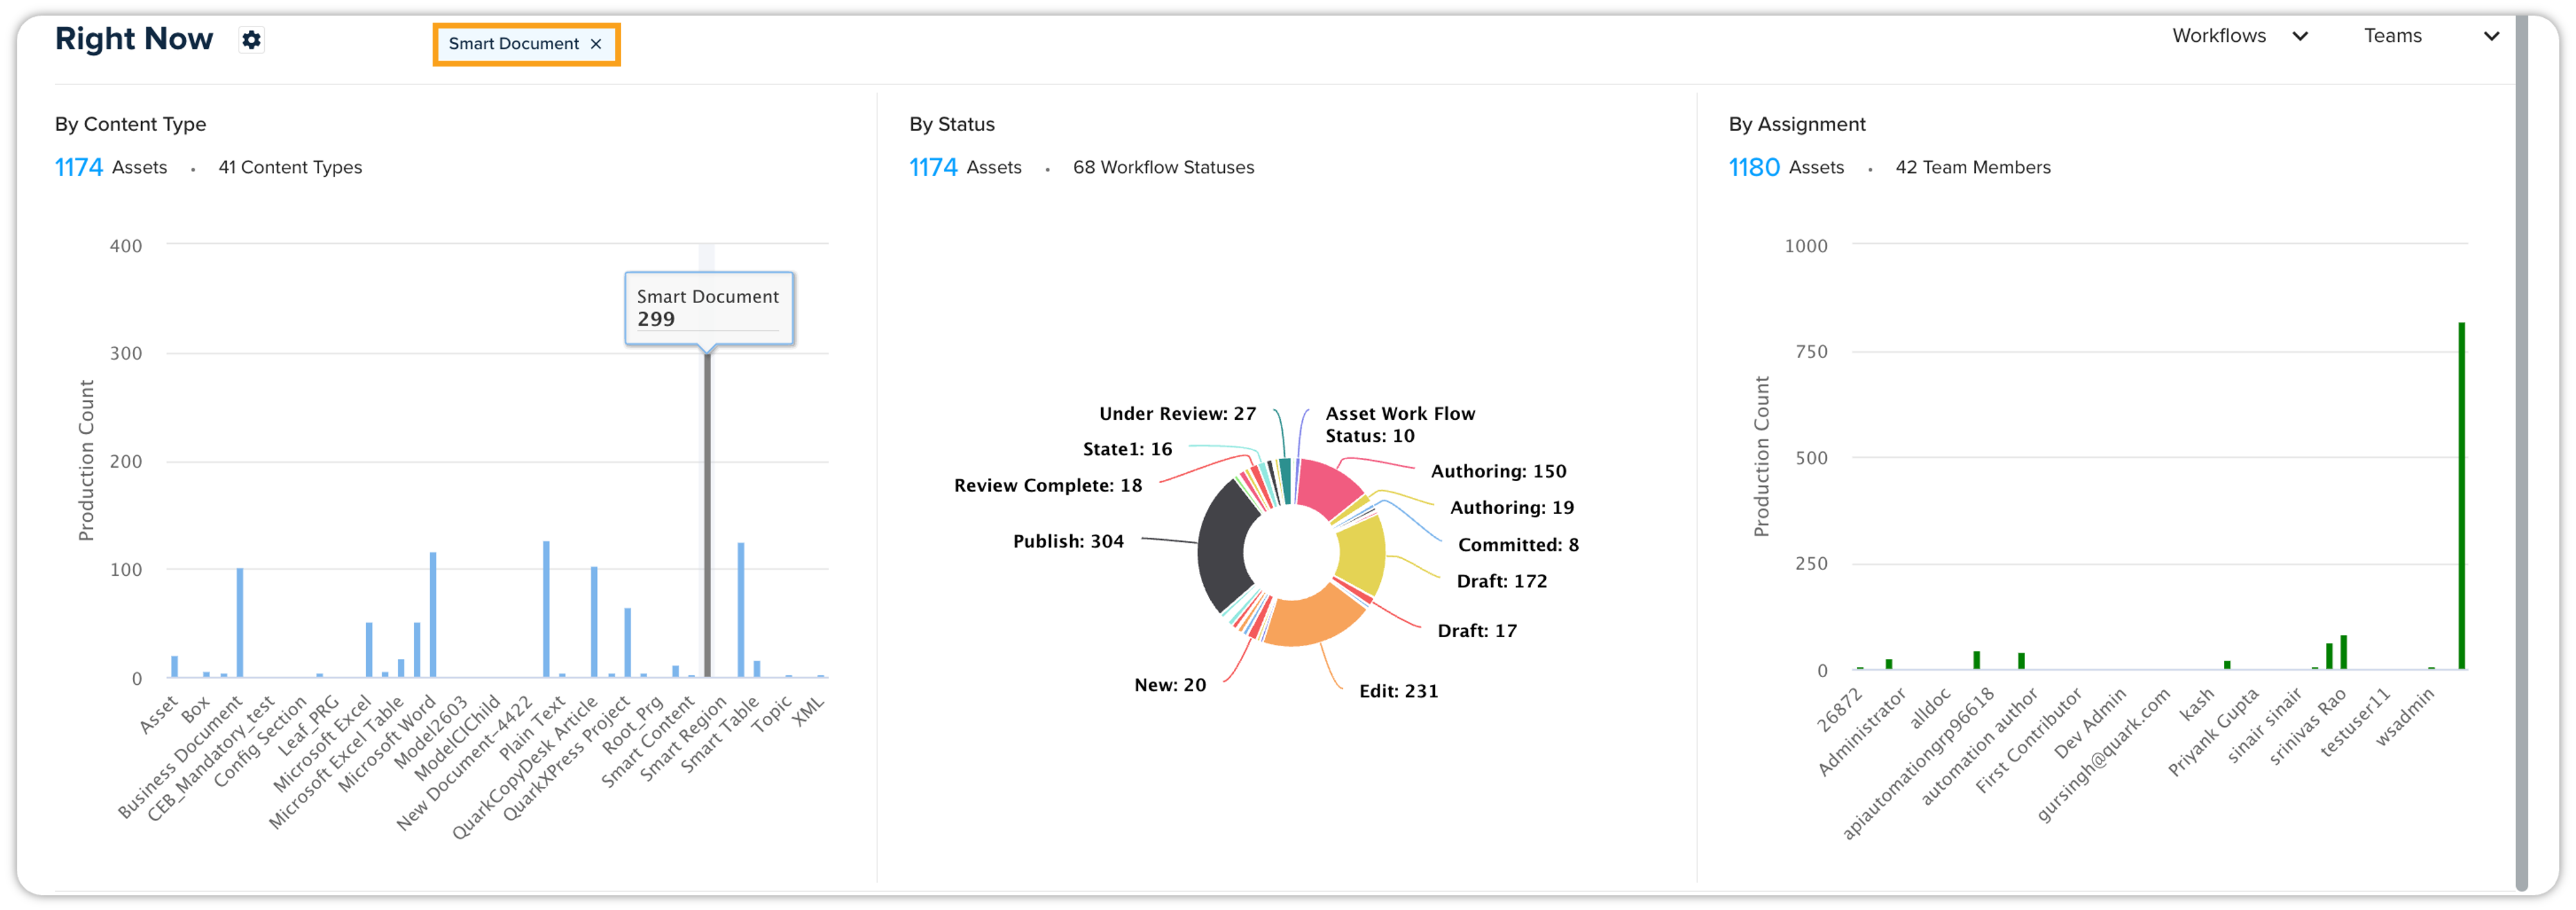
In the Content Type graph, select a content type graph bar.
-
The dashboard adds a tag and highlights the graph bar for the selected content type and displays the related statistics in the Status pie chart and Assignment graph.
Filter by status
To see the statistics for a status –
-
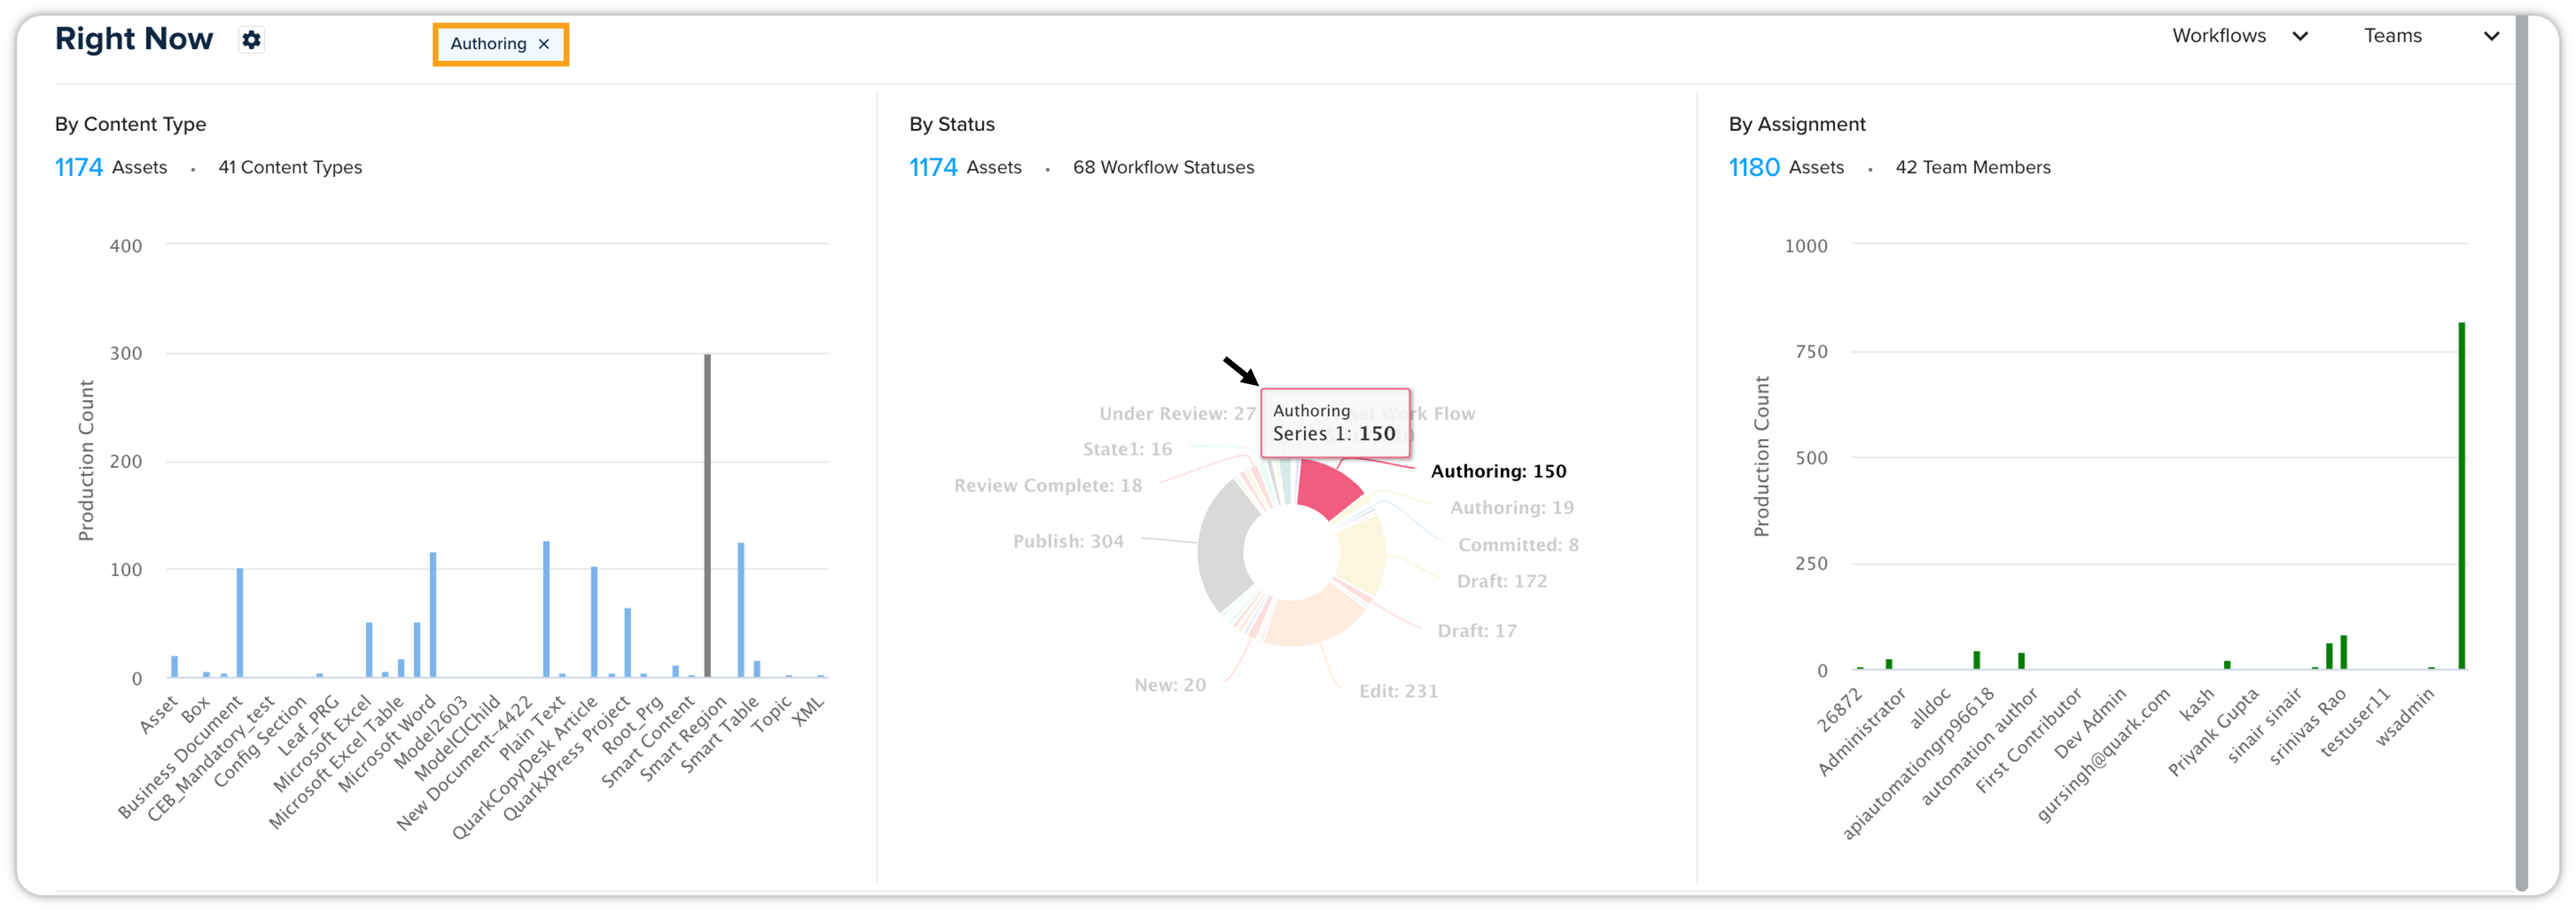
In the Status pie chart, select a status section.
-
The dashboard adds a tag and highlights the section for the selected status and displays the related statistics in the Content Type and Assignment graphs.
Filter by assigned user
To see the statistic for a user/user group –
-
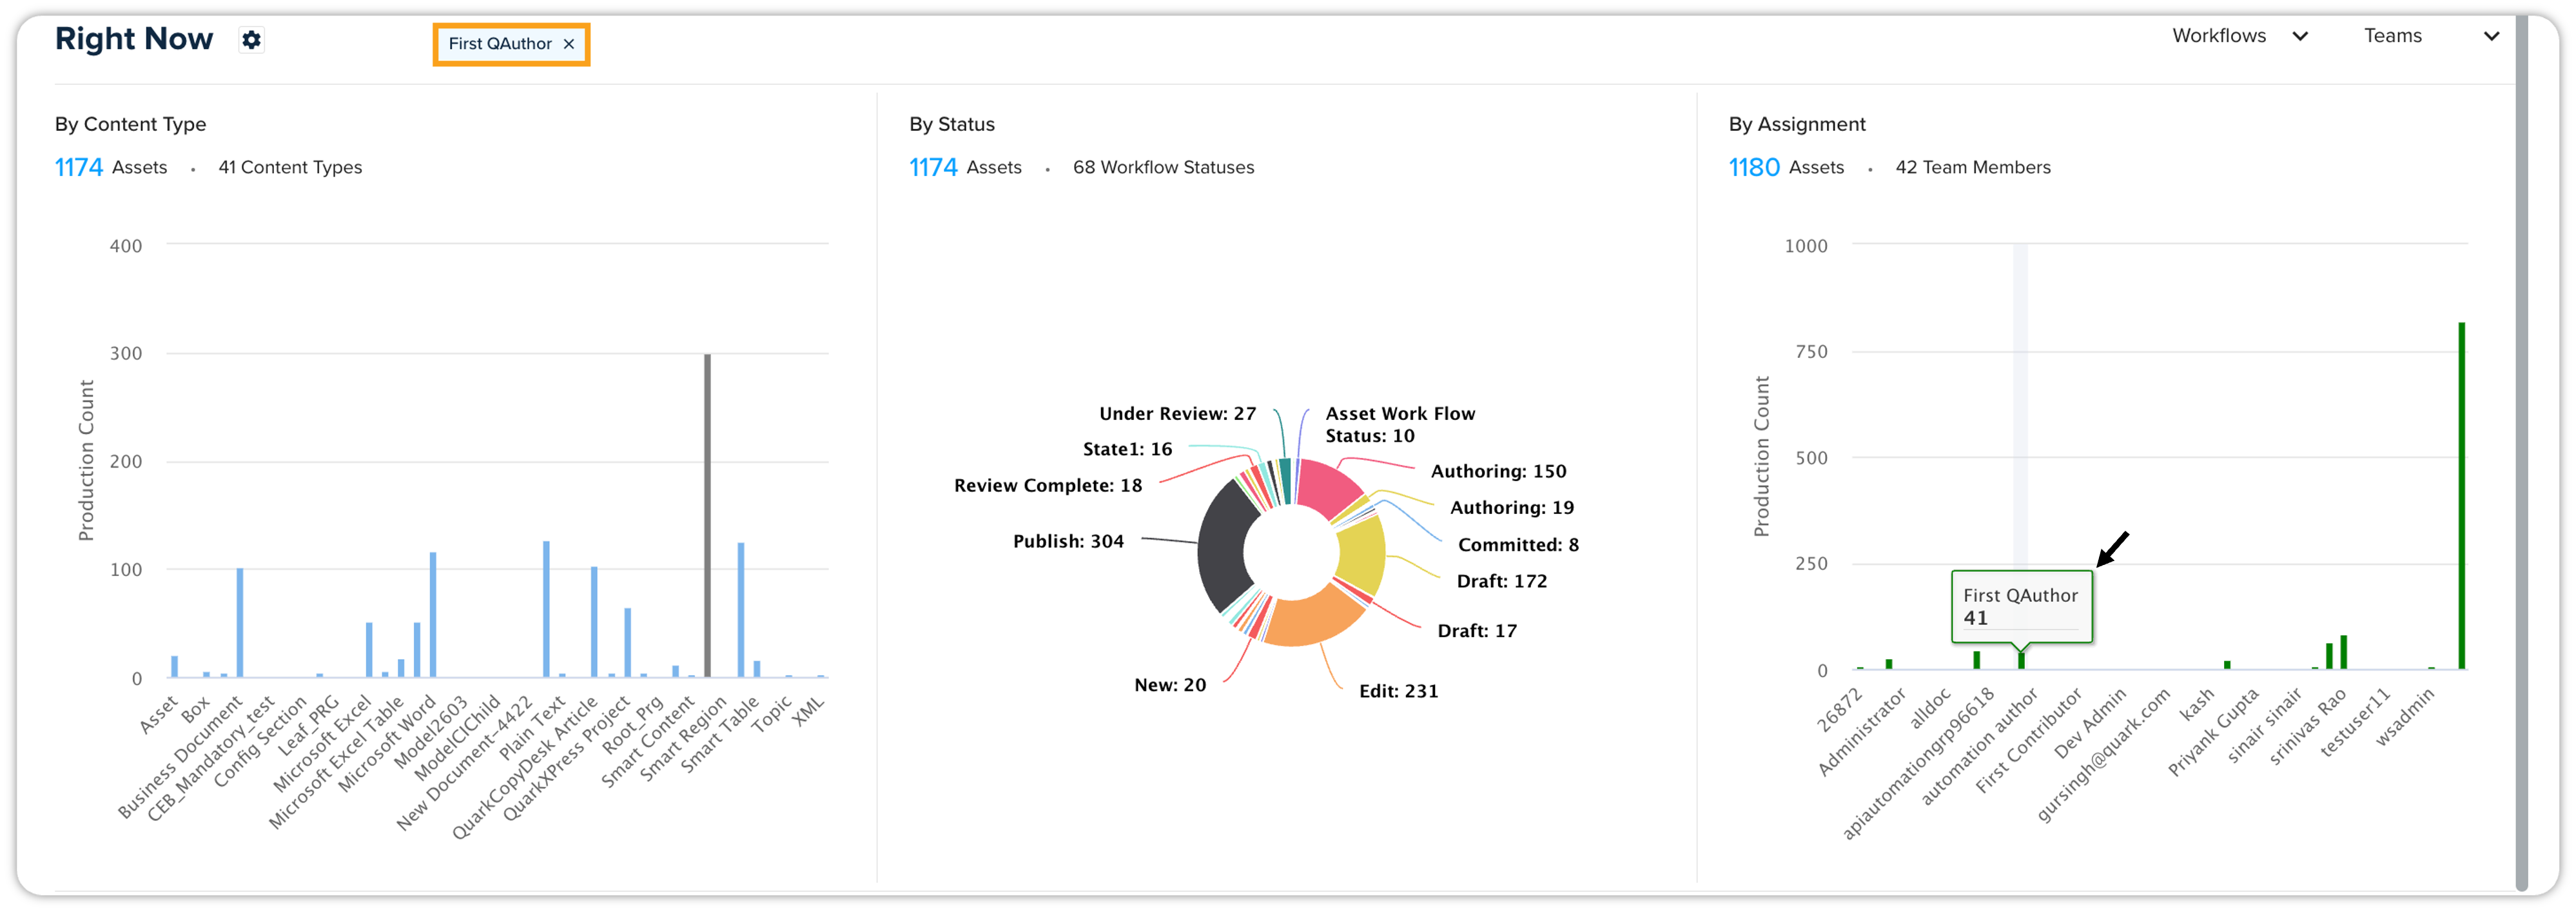
In the Assignment graph, select a user/user group graph bar.
-
The dashboard adds a tag and highlights the graph bar for the selected user/user group and displays the related statistics in the Status pie chart and Content Type graph.
Filter by workflow
To see the statistic for a workflow –
-
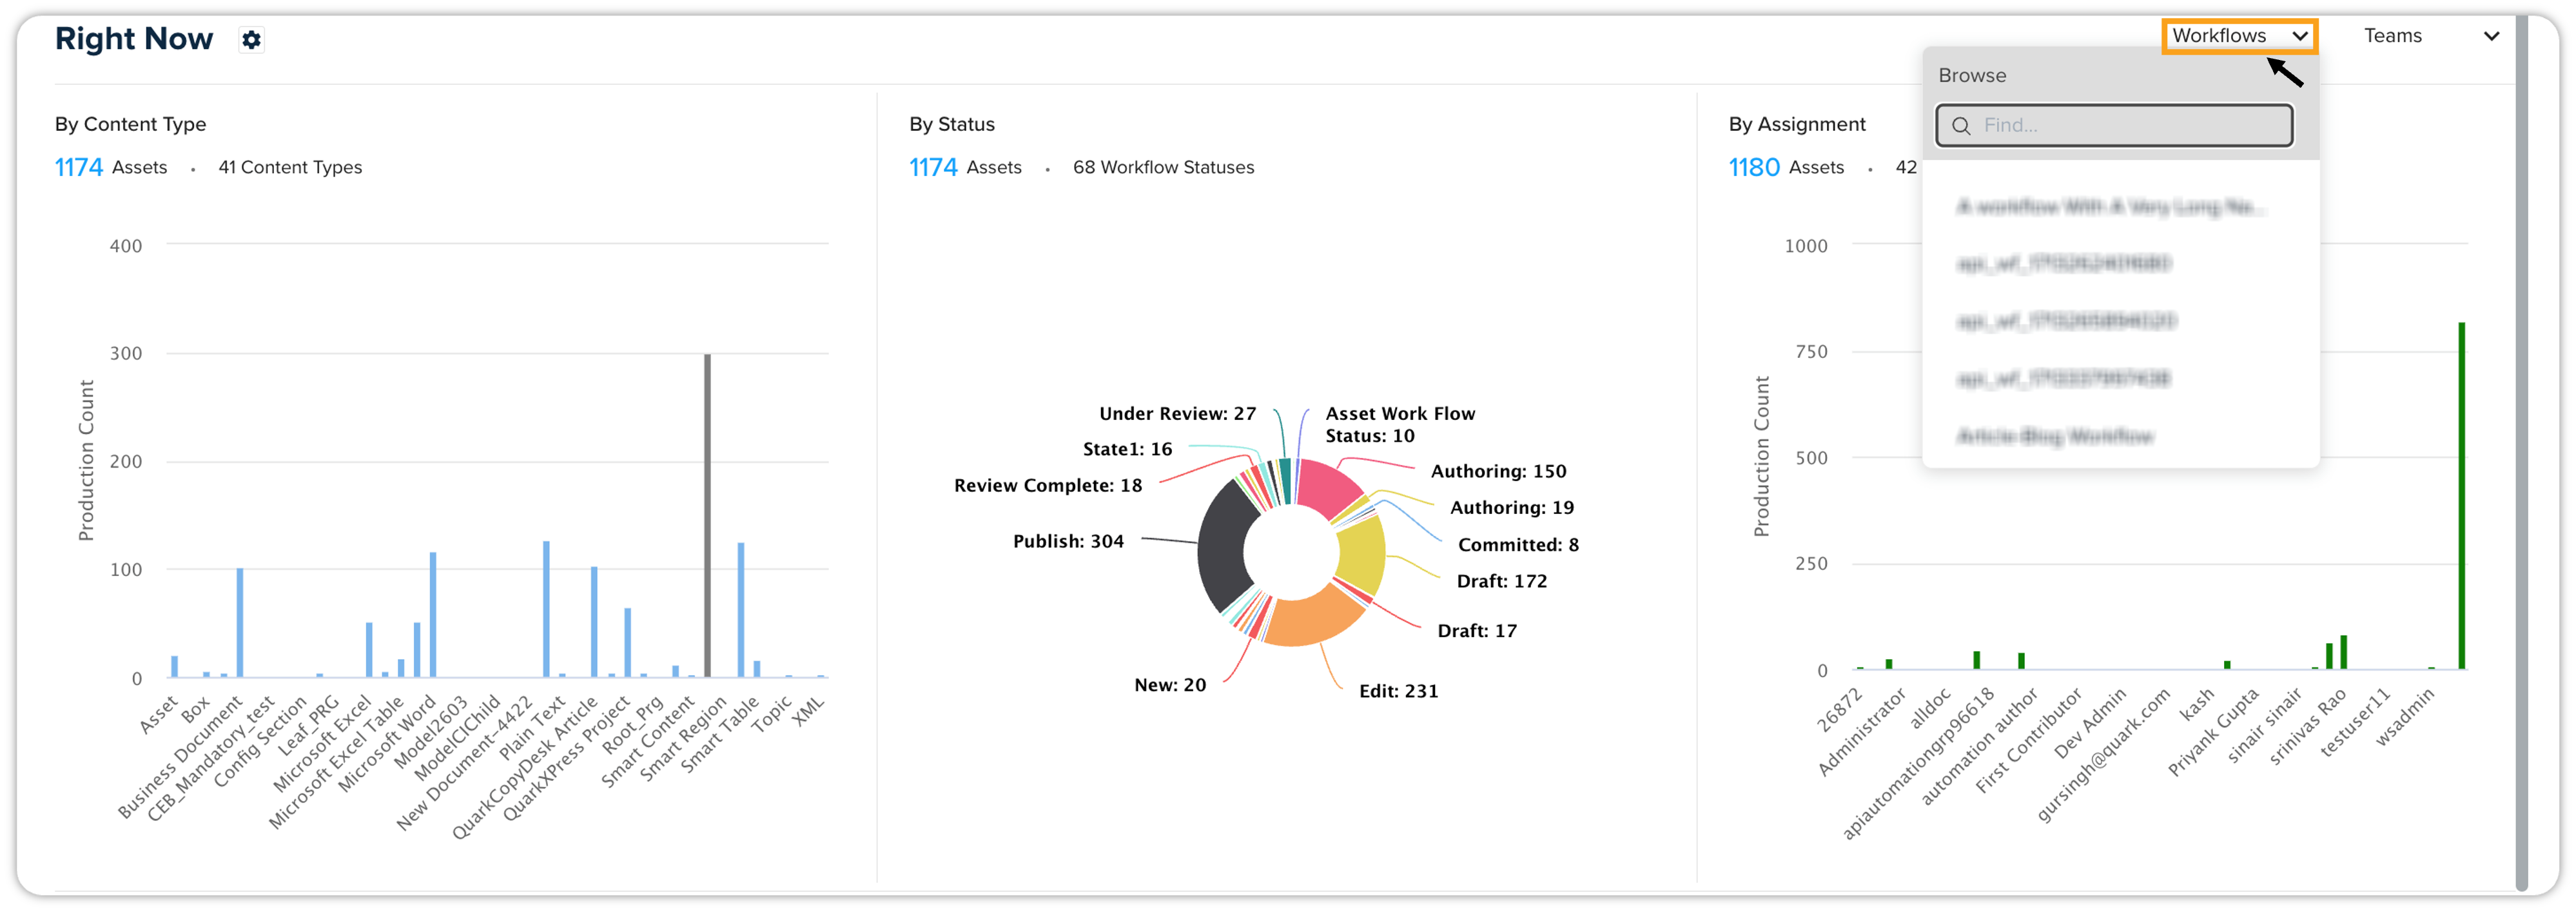
Select the Workflows drop-down menu at the upper right corner of the section Right Now.
-
Select a workflow.
-
The dashboard adds the tag for the selected workflow and displays the statistics for the selected workflow.
Filter by team
To see the statistics for a team –
-
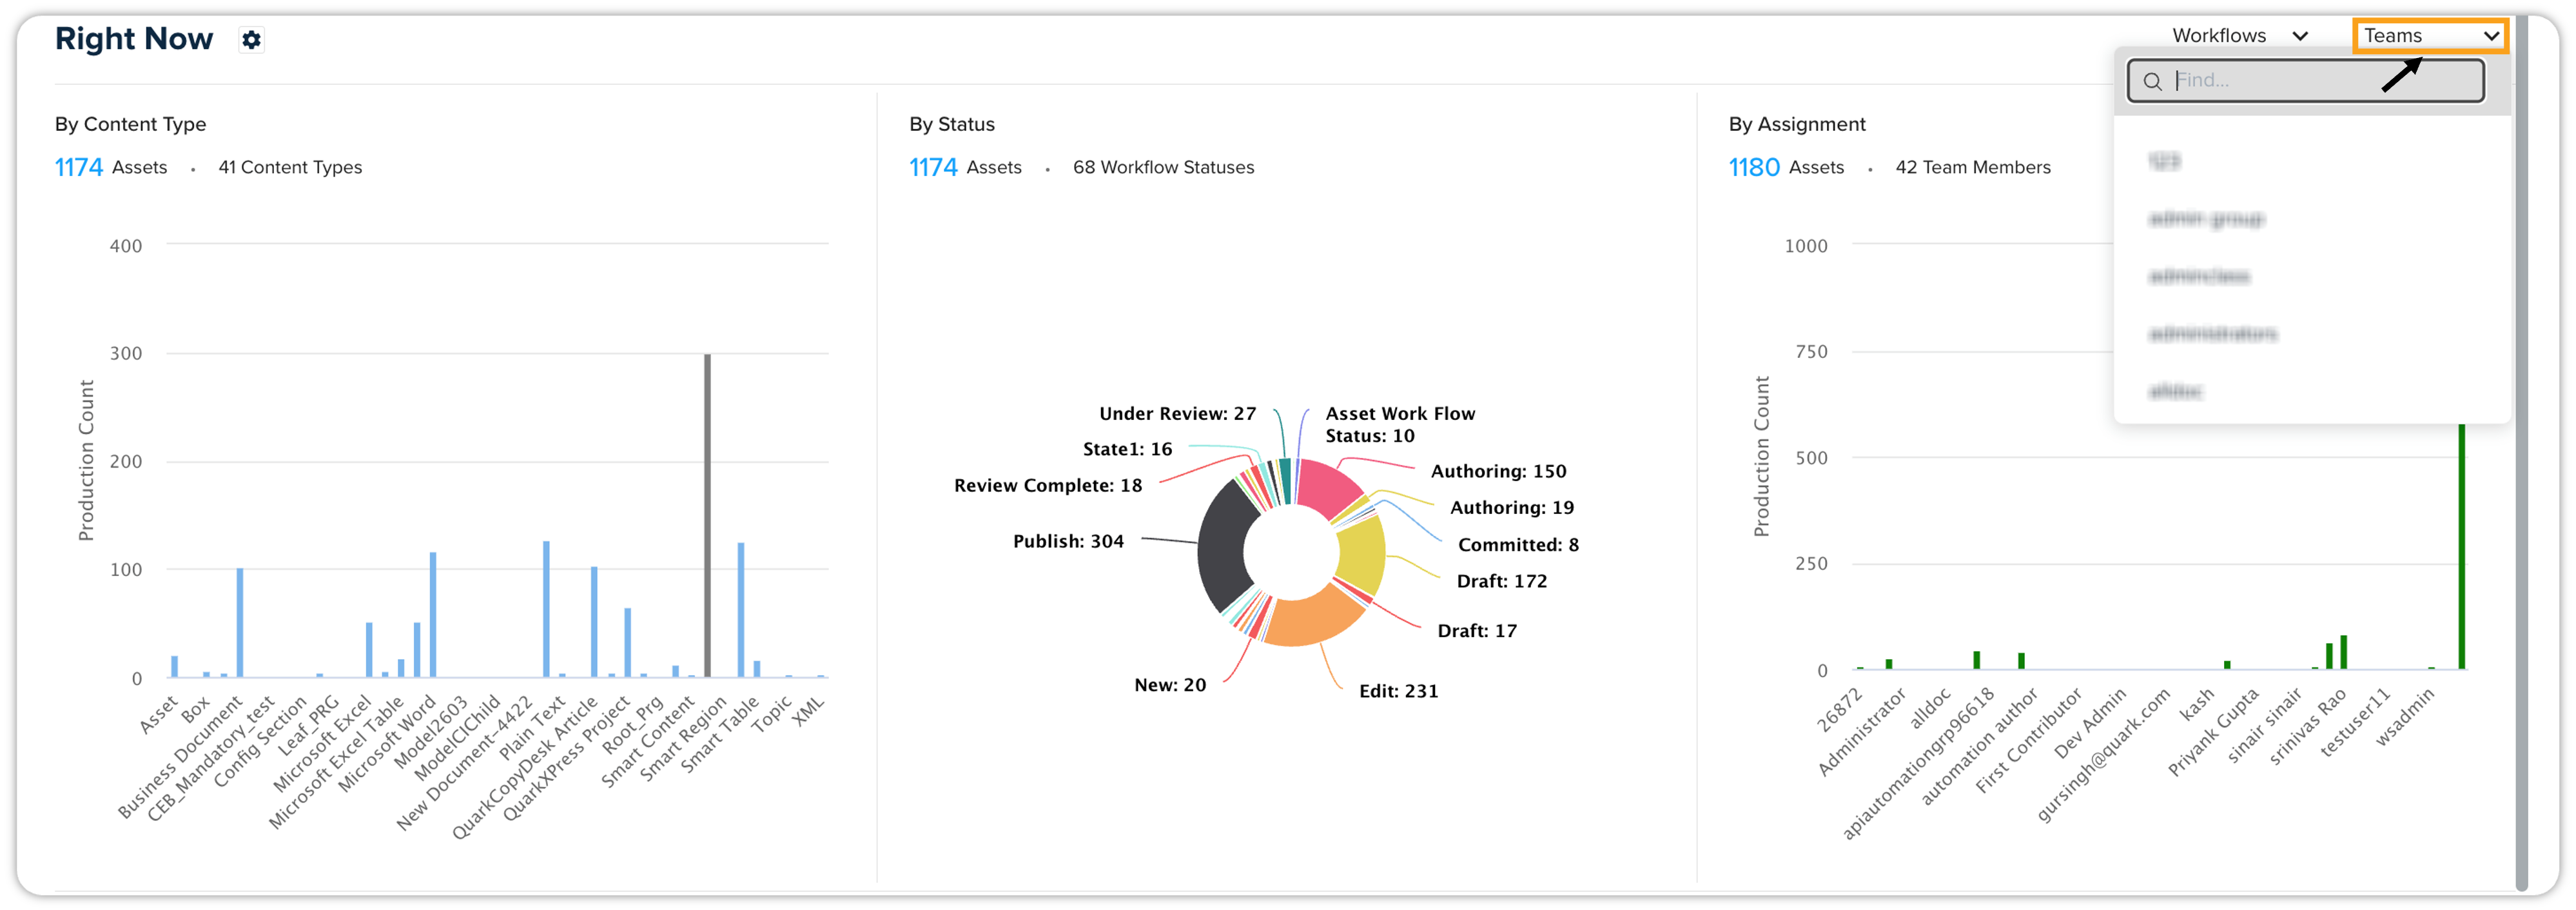
Select the Teams drop-down menu at the upper right corner of the section Right Now.
-
Select a team.
-
The dashboard adds the tag for the selected team and displays the statistics for the selected team.
Content Delivery
The Content Delivery dashboard provides insights into how your content is being delivered to your audience across various channels. You can effectively manage and track the delivery of your content across various parameters.
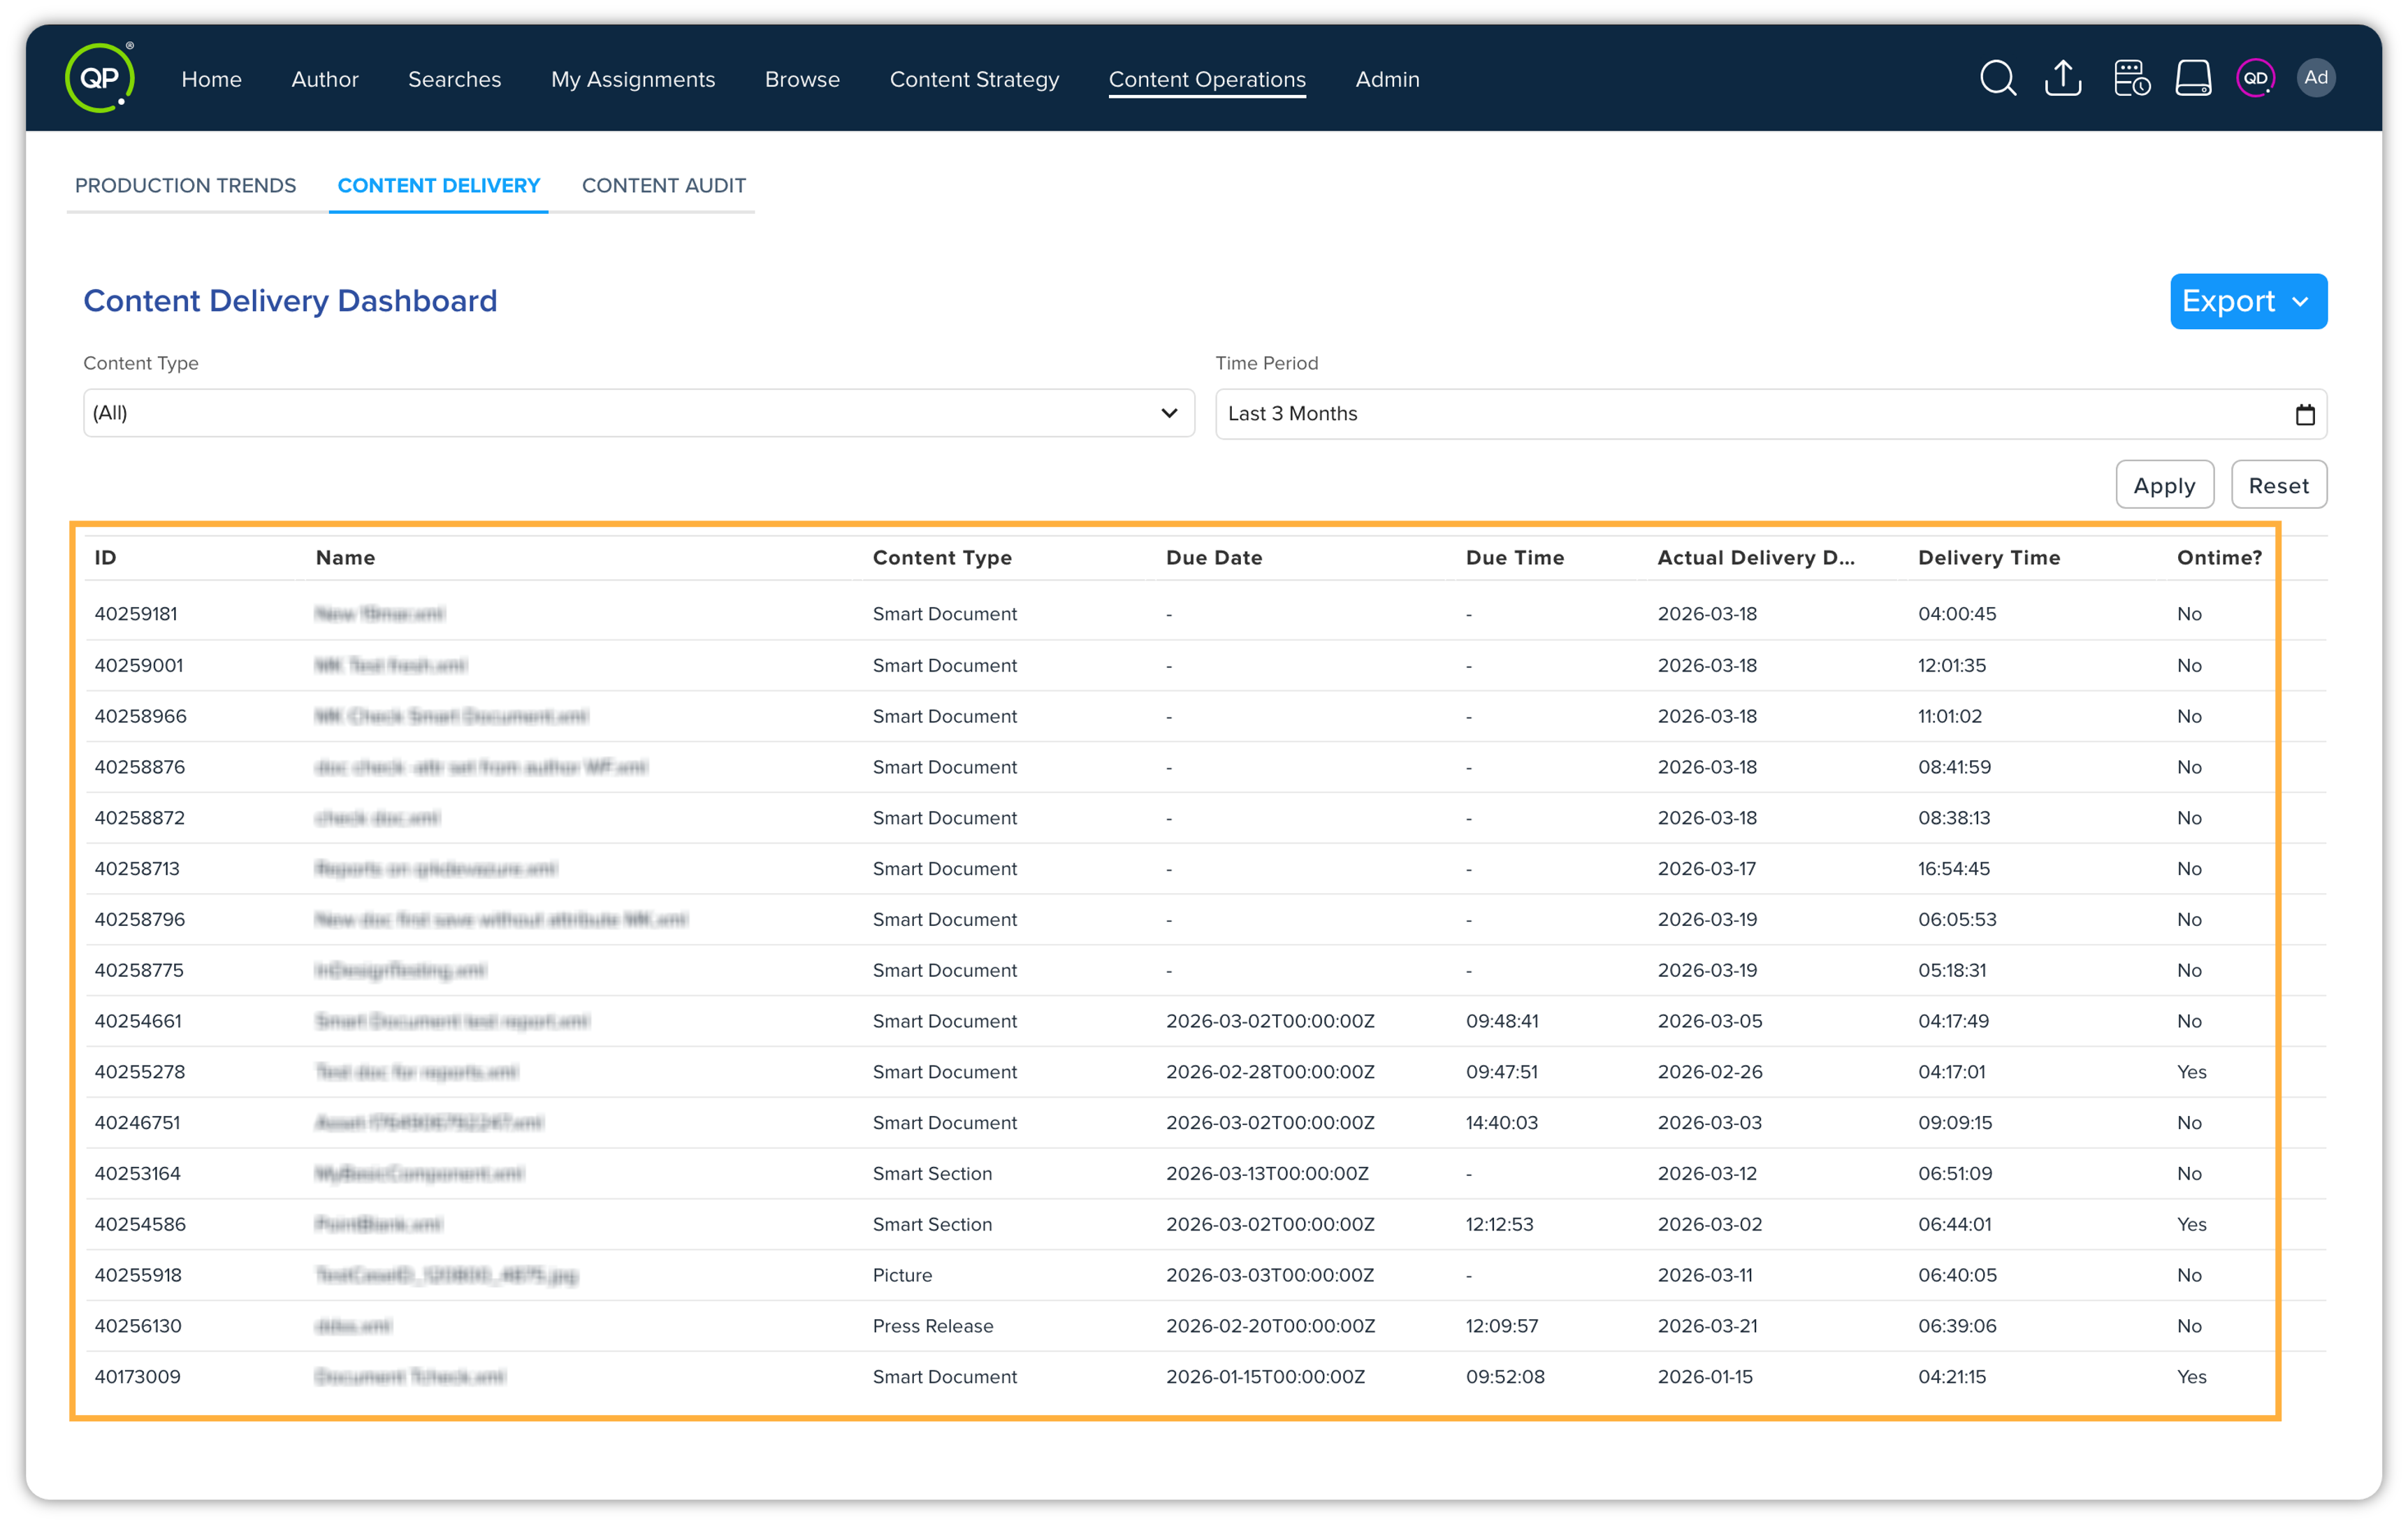
The dashboard includes the following columns –
-
ID: This column displays the IDs of the content being delivered.
-
Name: This column displays the title or name of the content being delivered.
-
Content Type: Indicates the type or category of the content being delivered.
-
Due Date: Shows the scheduled date by which the content is expected to be delivered.
-
Due Time: Specifies the time at which the content is expected to be delivered.
-
Actual Delivery Date: Displays the date the content was delivered on.
-
Delivery Time: Specifies when the content was delivered.
-
On-Time: Indicates whether the content was delivered on time or not.
Filter options
There are two filter options –
-
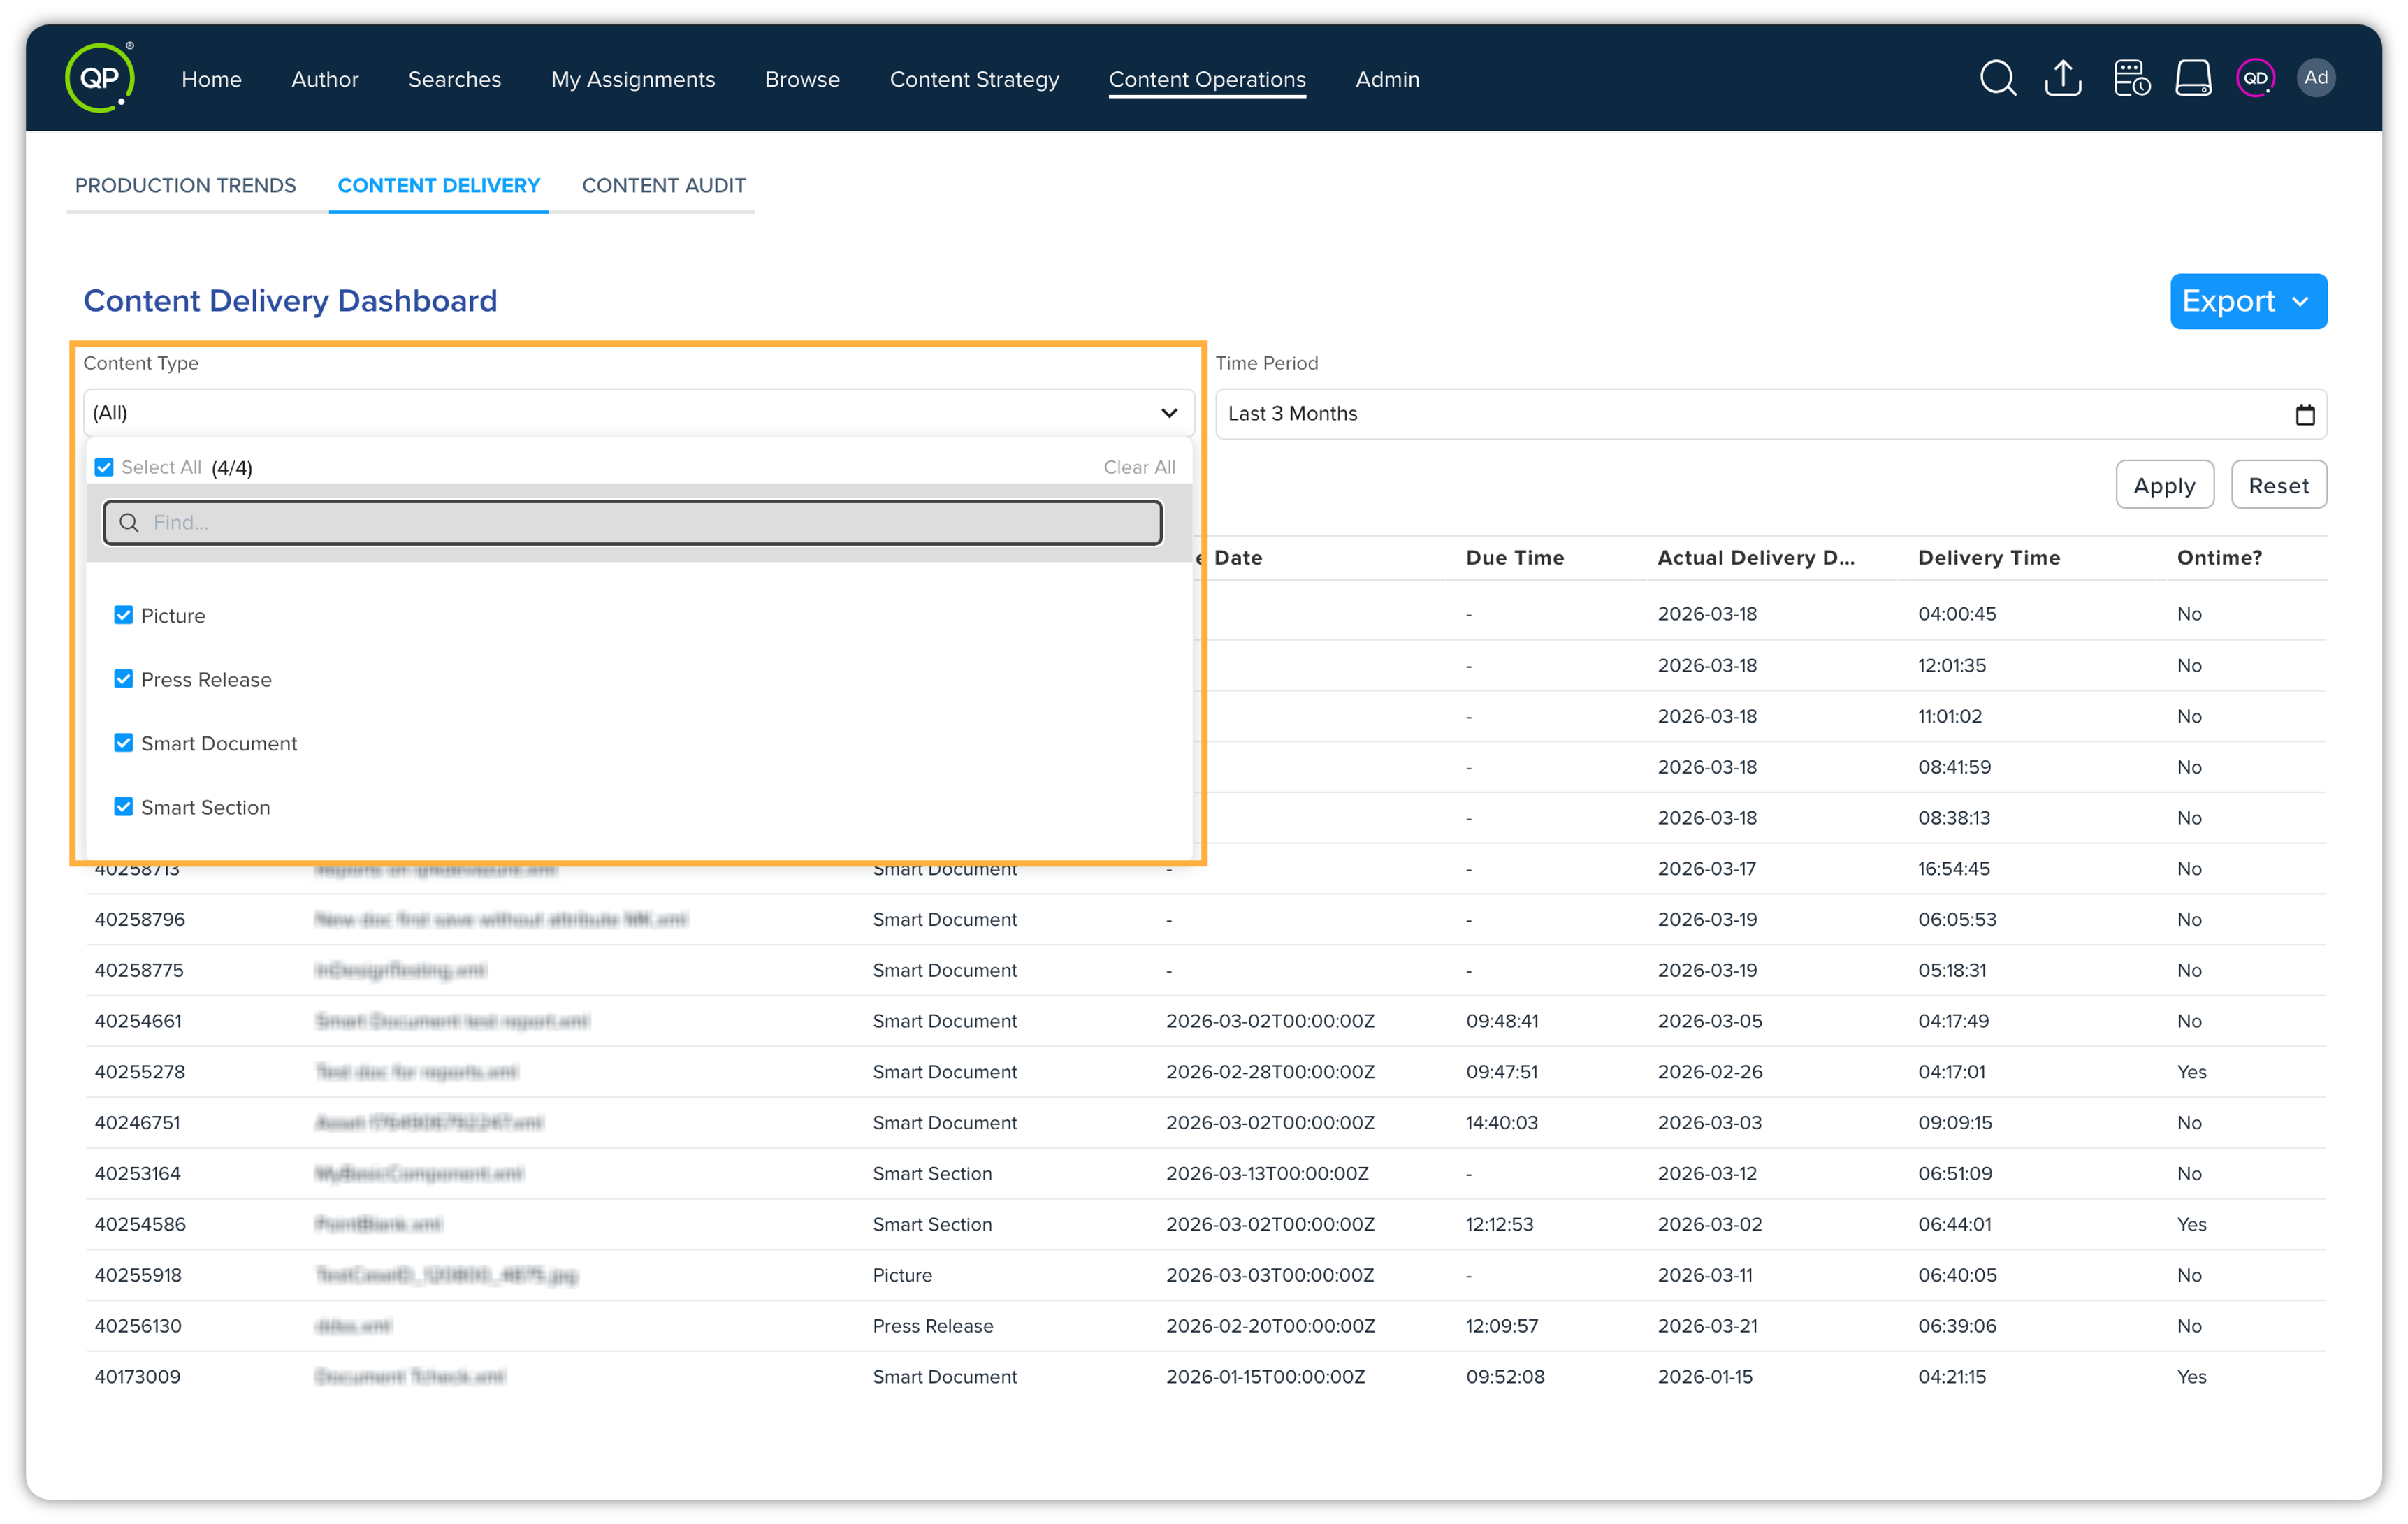
Filter by Content Type: Use this option to filter the content by its types, for example — Journal Article.
-
Filter by Time Period: You can adjust the time-period by dragging the switch to a particular date.
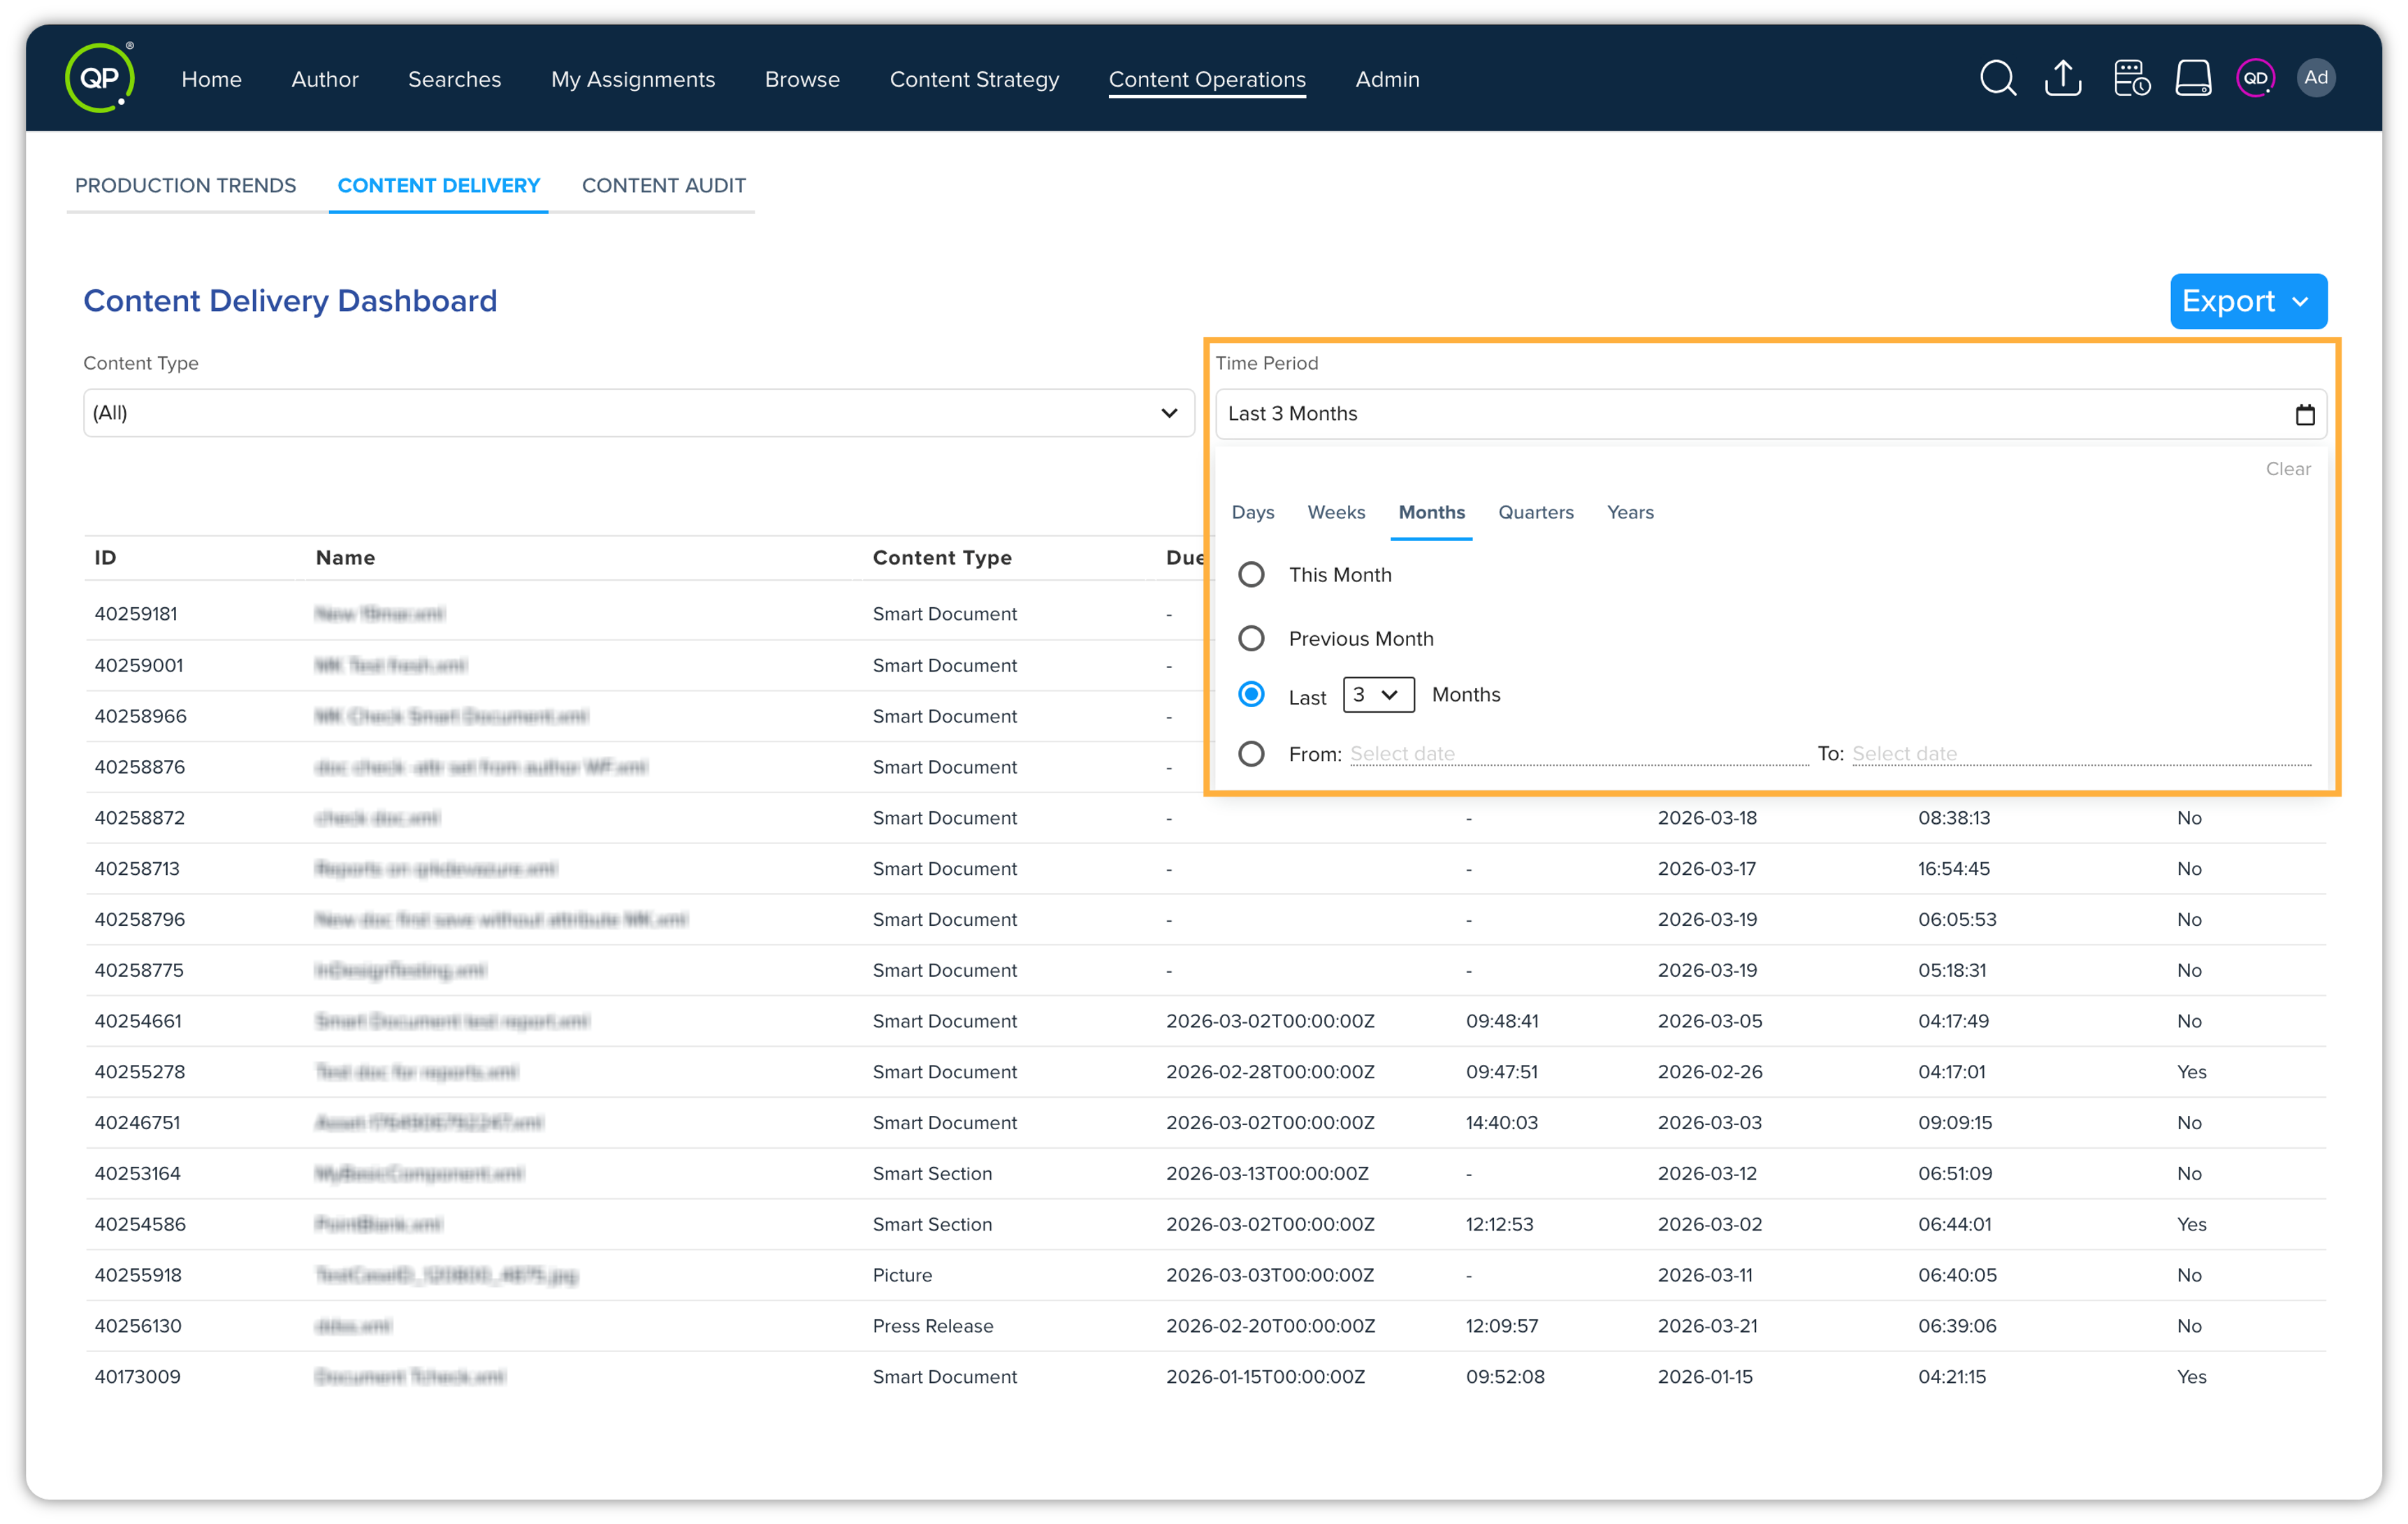
Export Content Delivery dashboard
You have the option to export the Content Delivery dashboard into an Excel file format or CSV format, allowing you to save the data to your local system for further analysis and reporting.
To export the dashboard, follow the steps shown below –
-
Locate the Export option within the dashboard interface.
-
Select the desired file format (CSV or Excel).
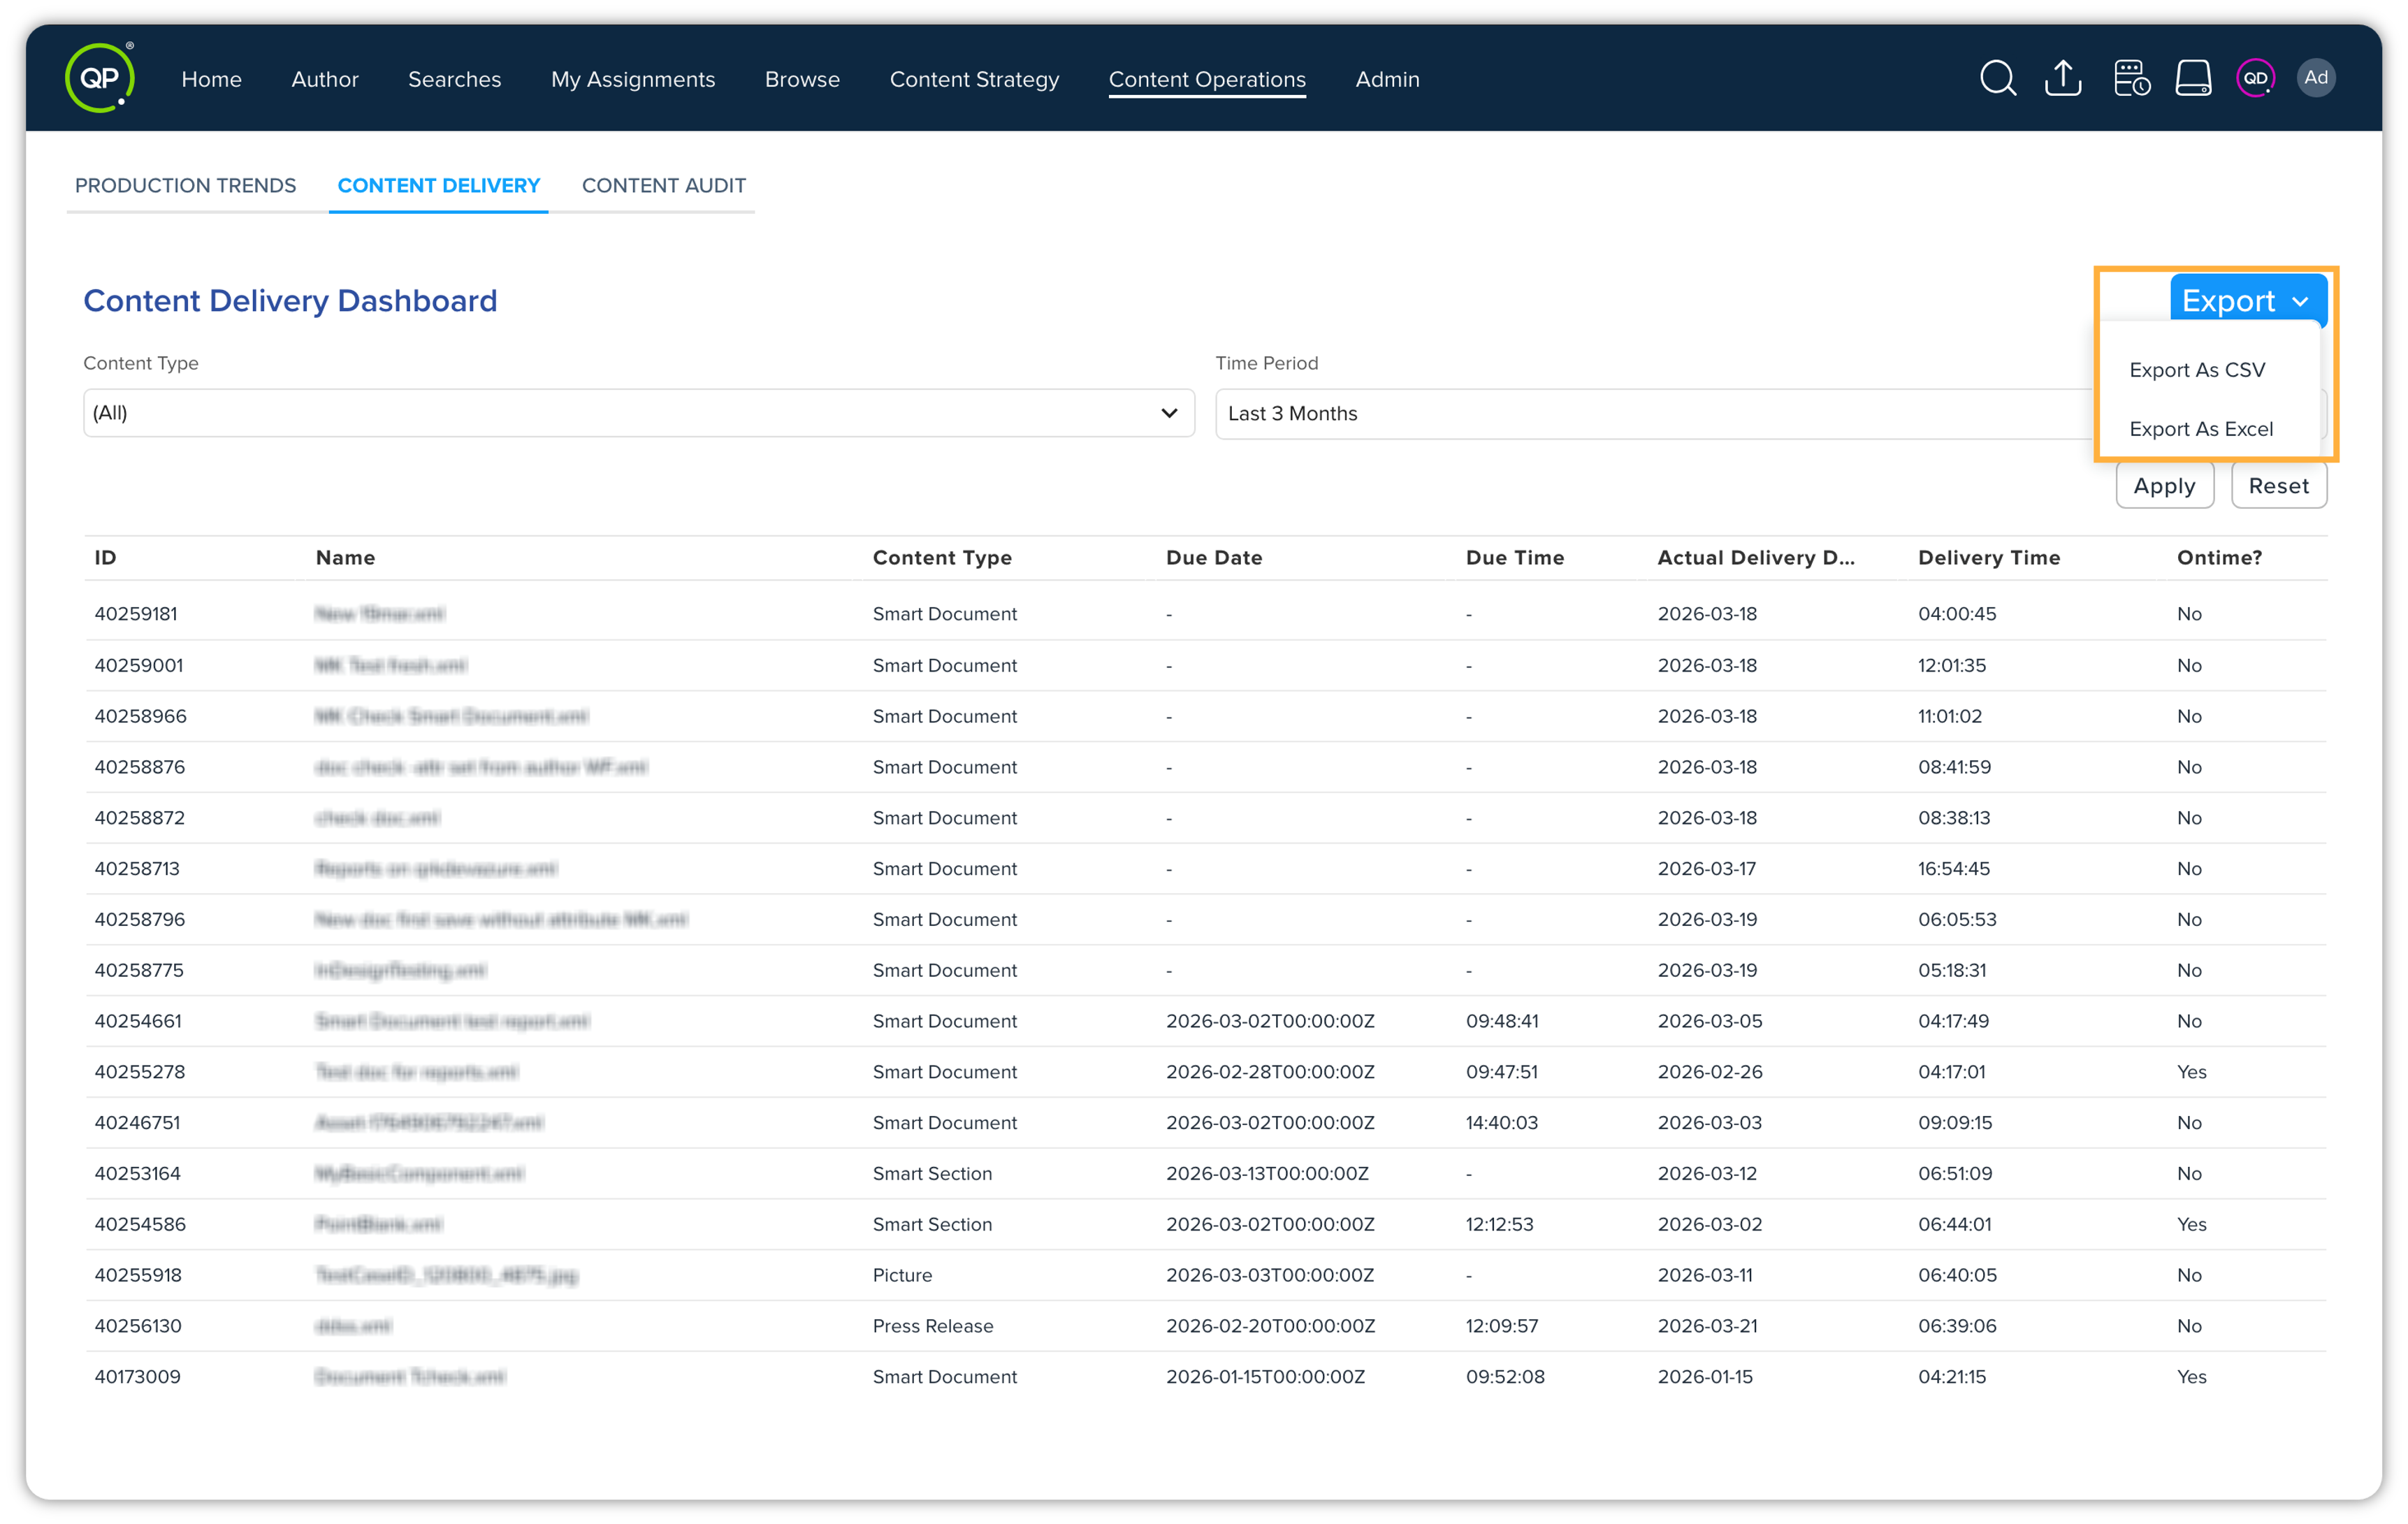
-
The Exporting dialog pops up showing the exporting process is in-progress. And within a few seconds, the report will be automatically downloaded.
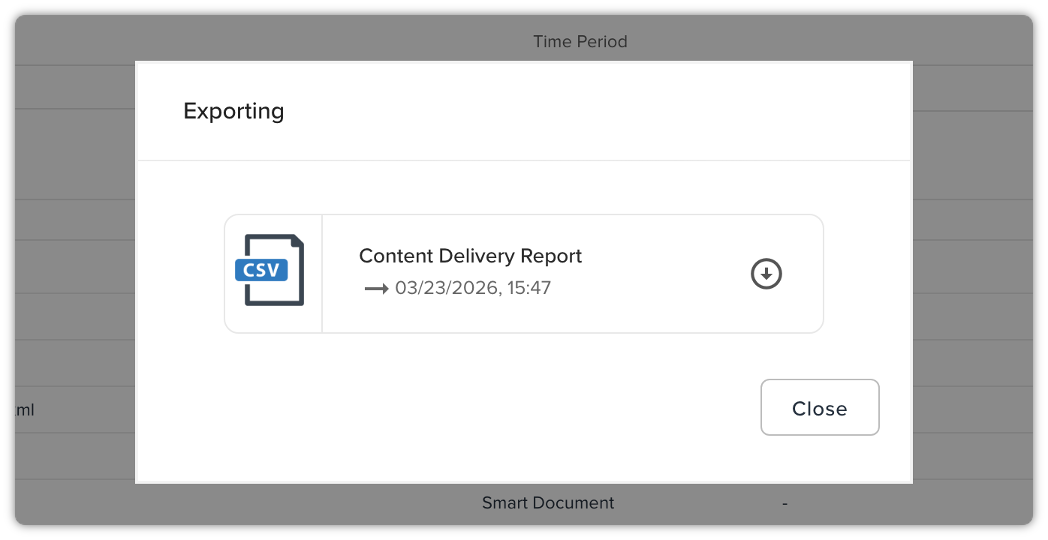
This export functionality enables you to maintain records, analyze trends, and generate custom reports based on the delivery performance of your content.
Content Audit
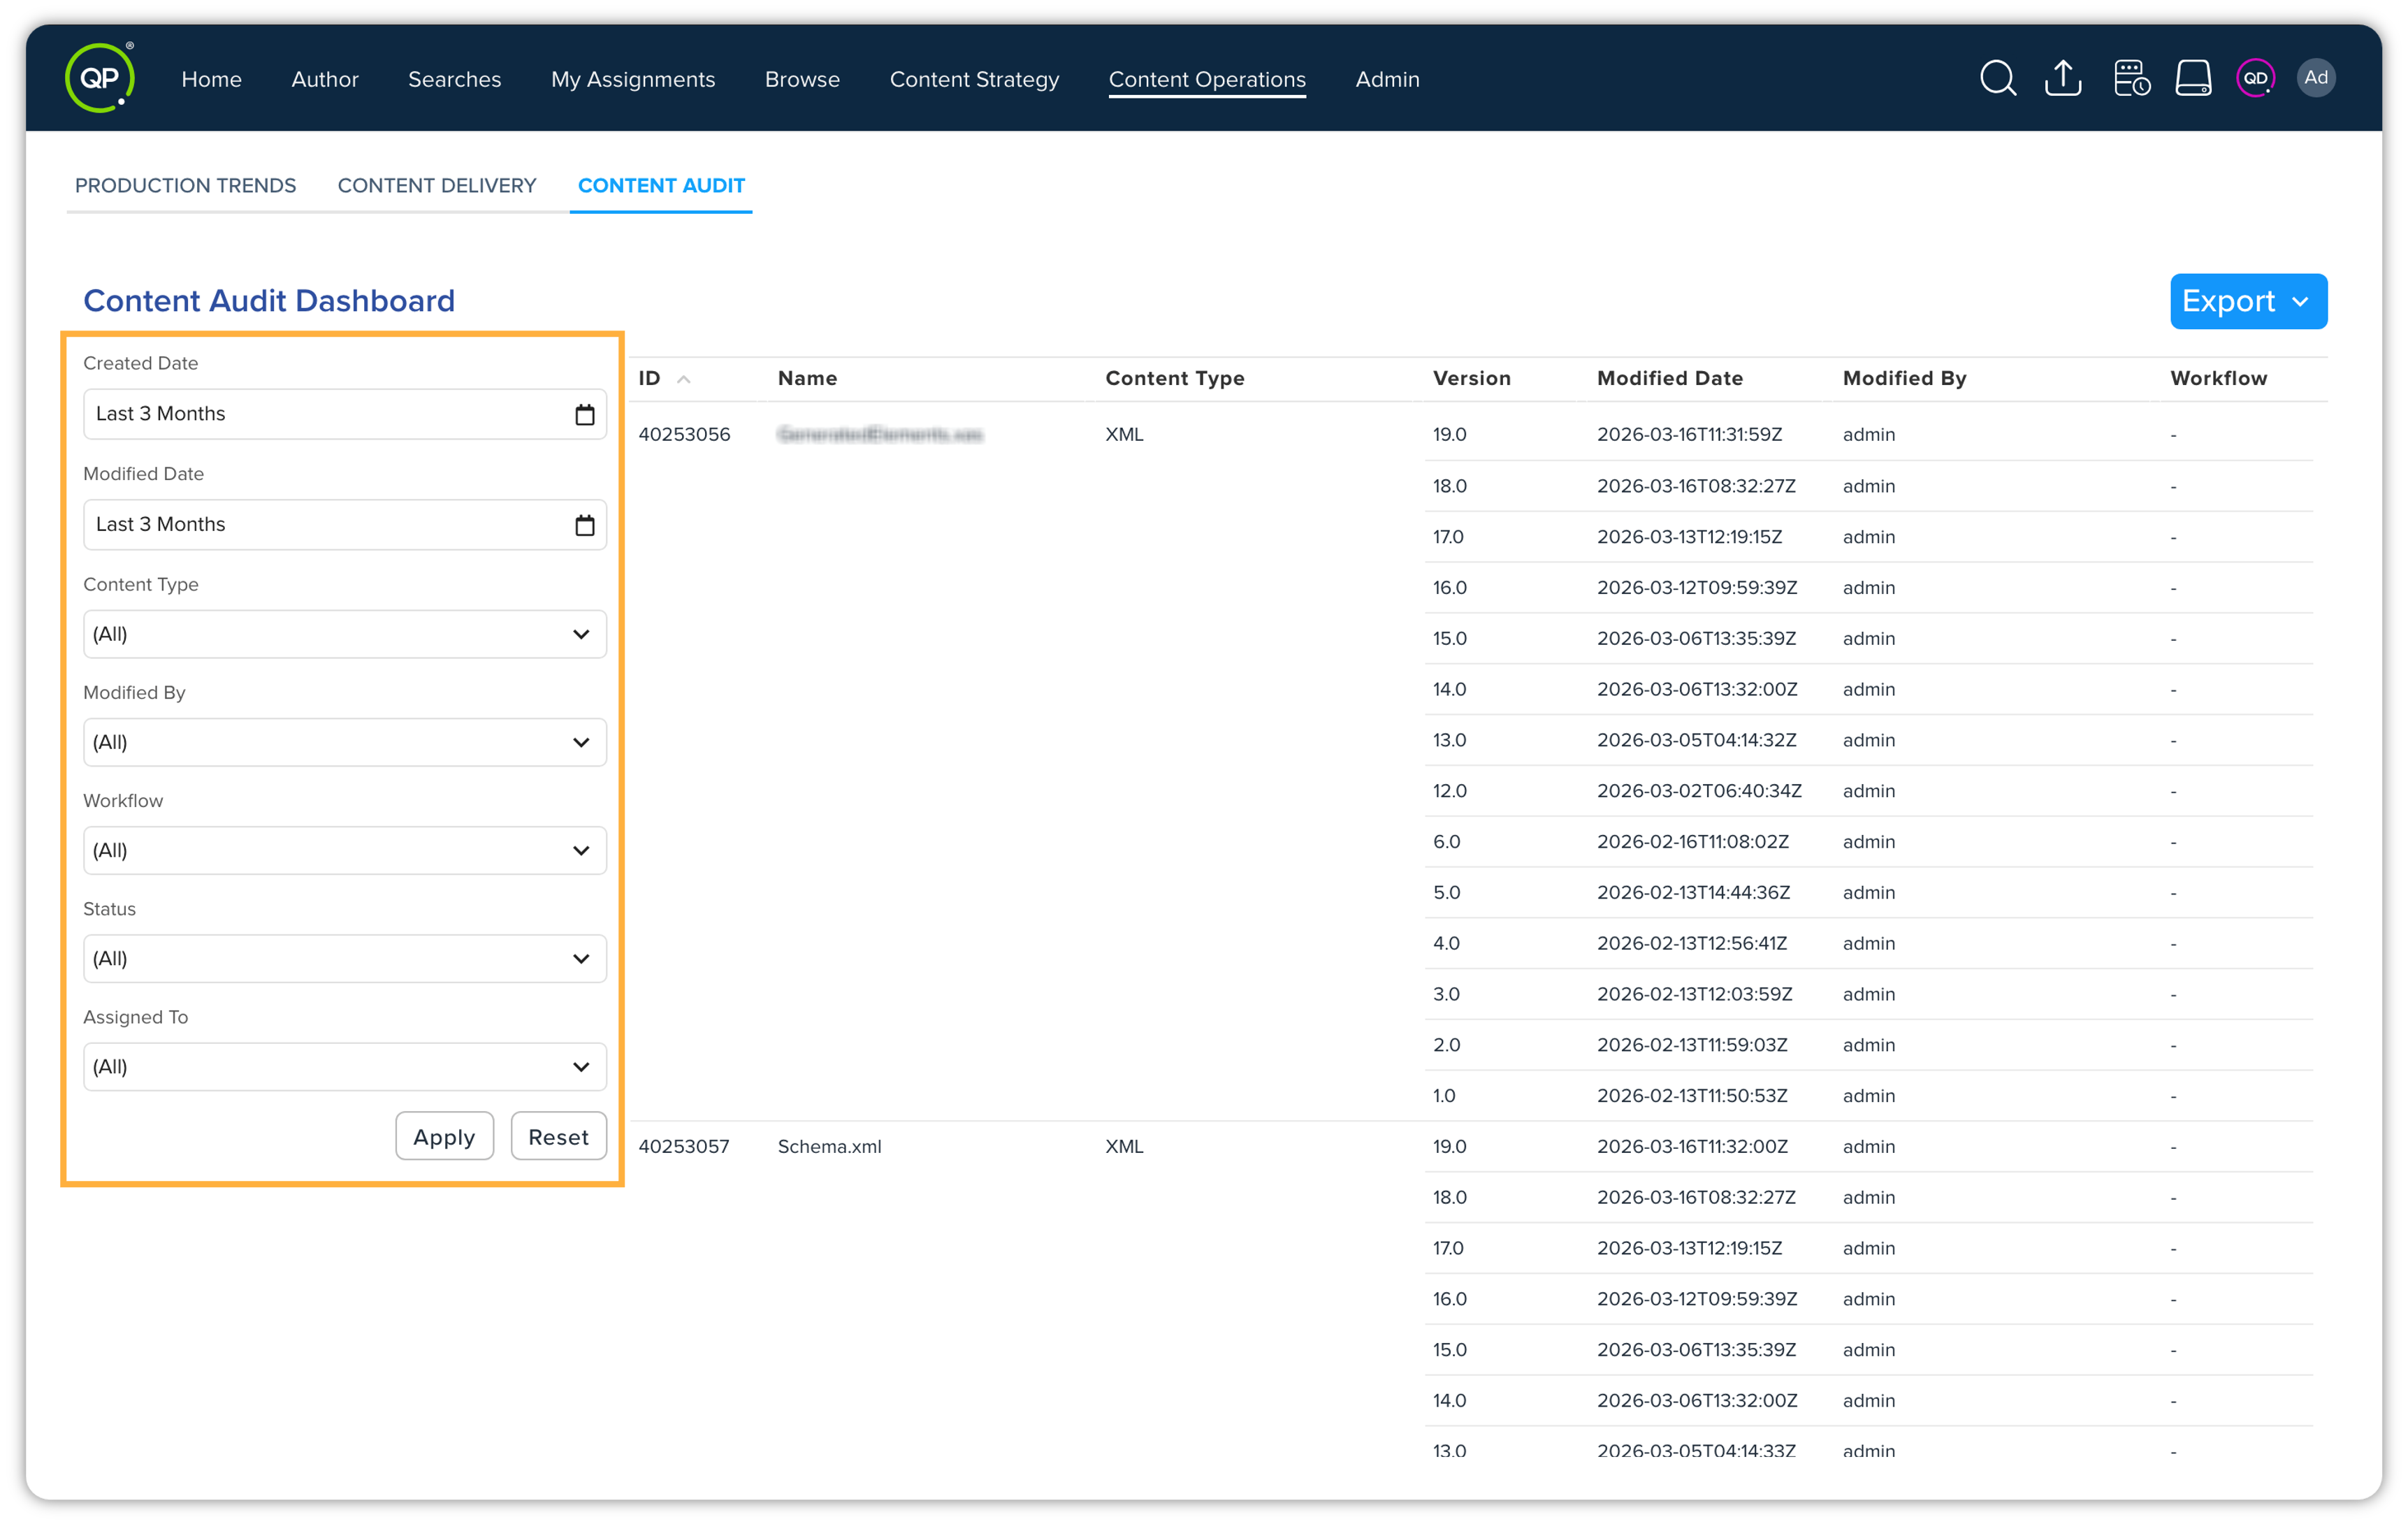
The Content Audit dashboard helps you assess the quality and effectiveness of your content by conducting a detailed audit. Identify content gaps, performance issues, and opportunities for improvement to enhance the overall quality of your content.
The Content Audit dashboard provides you with a comprehensive overview of your content, detailing its progression and status since its creation.
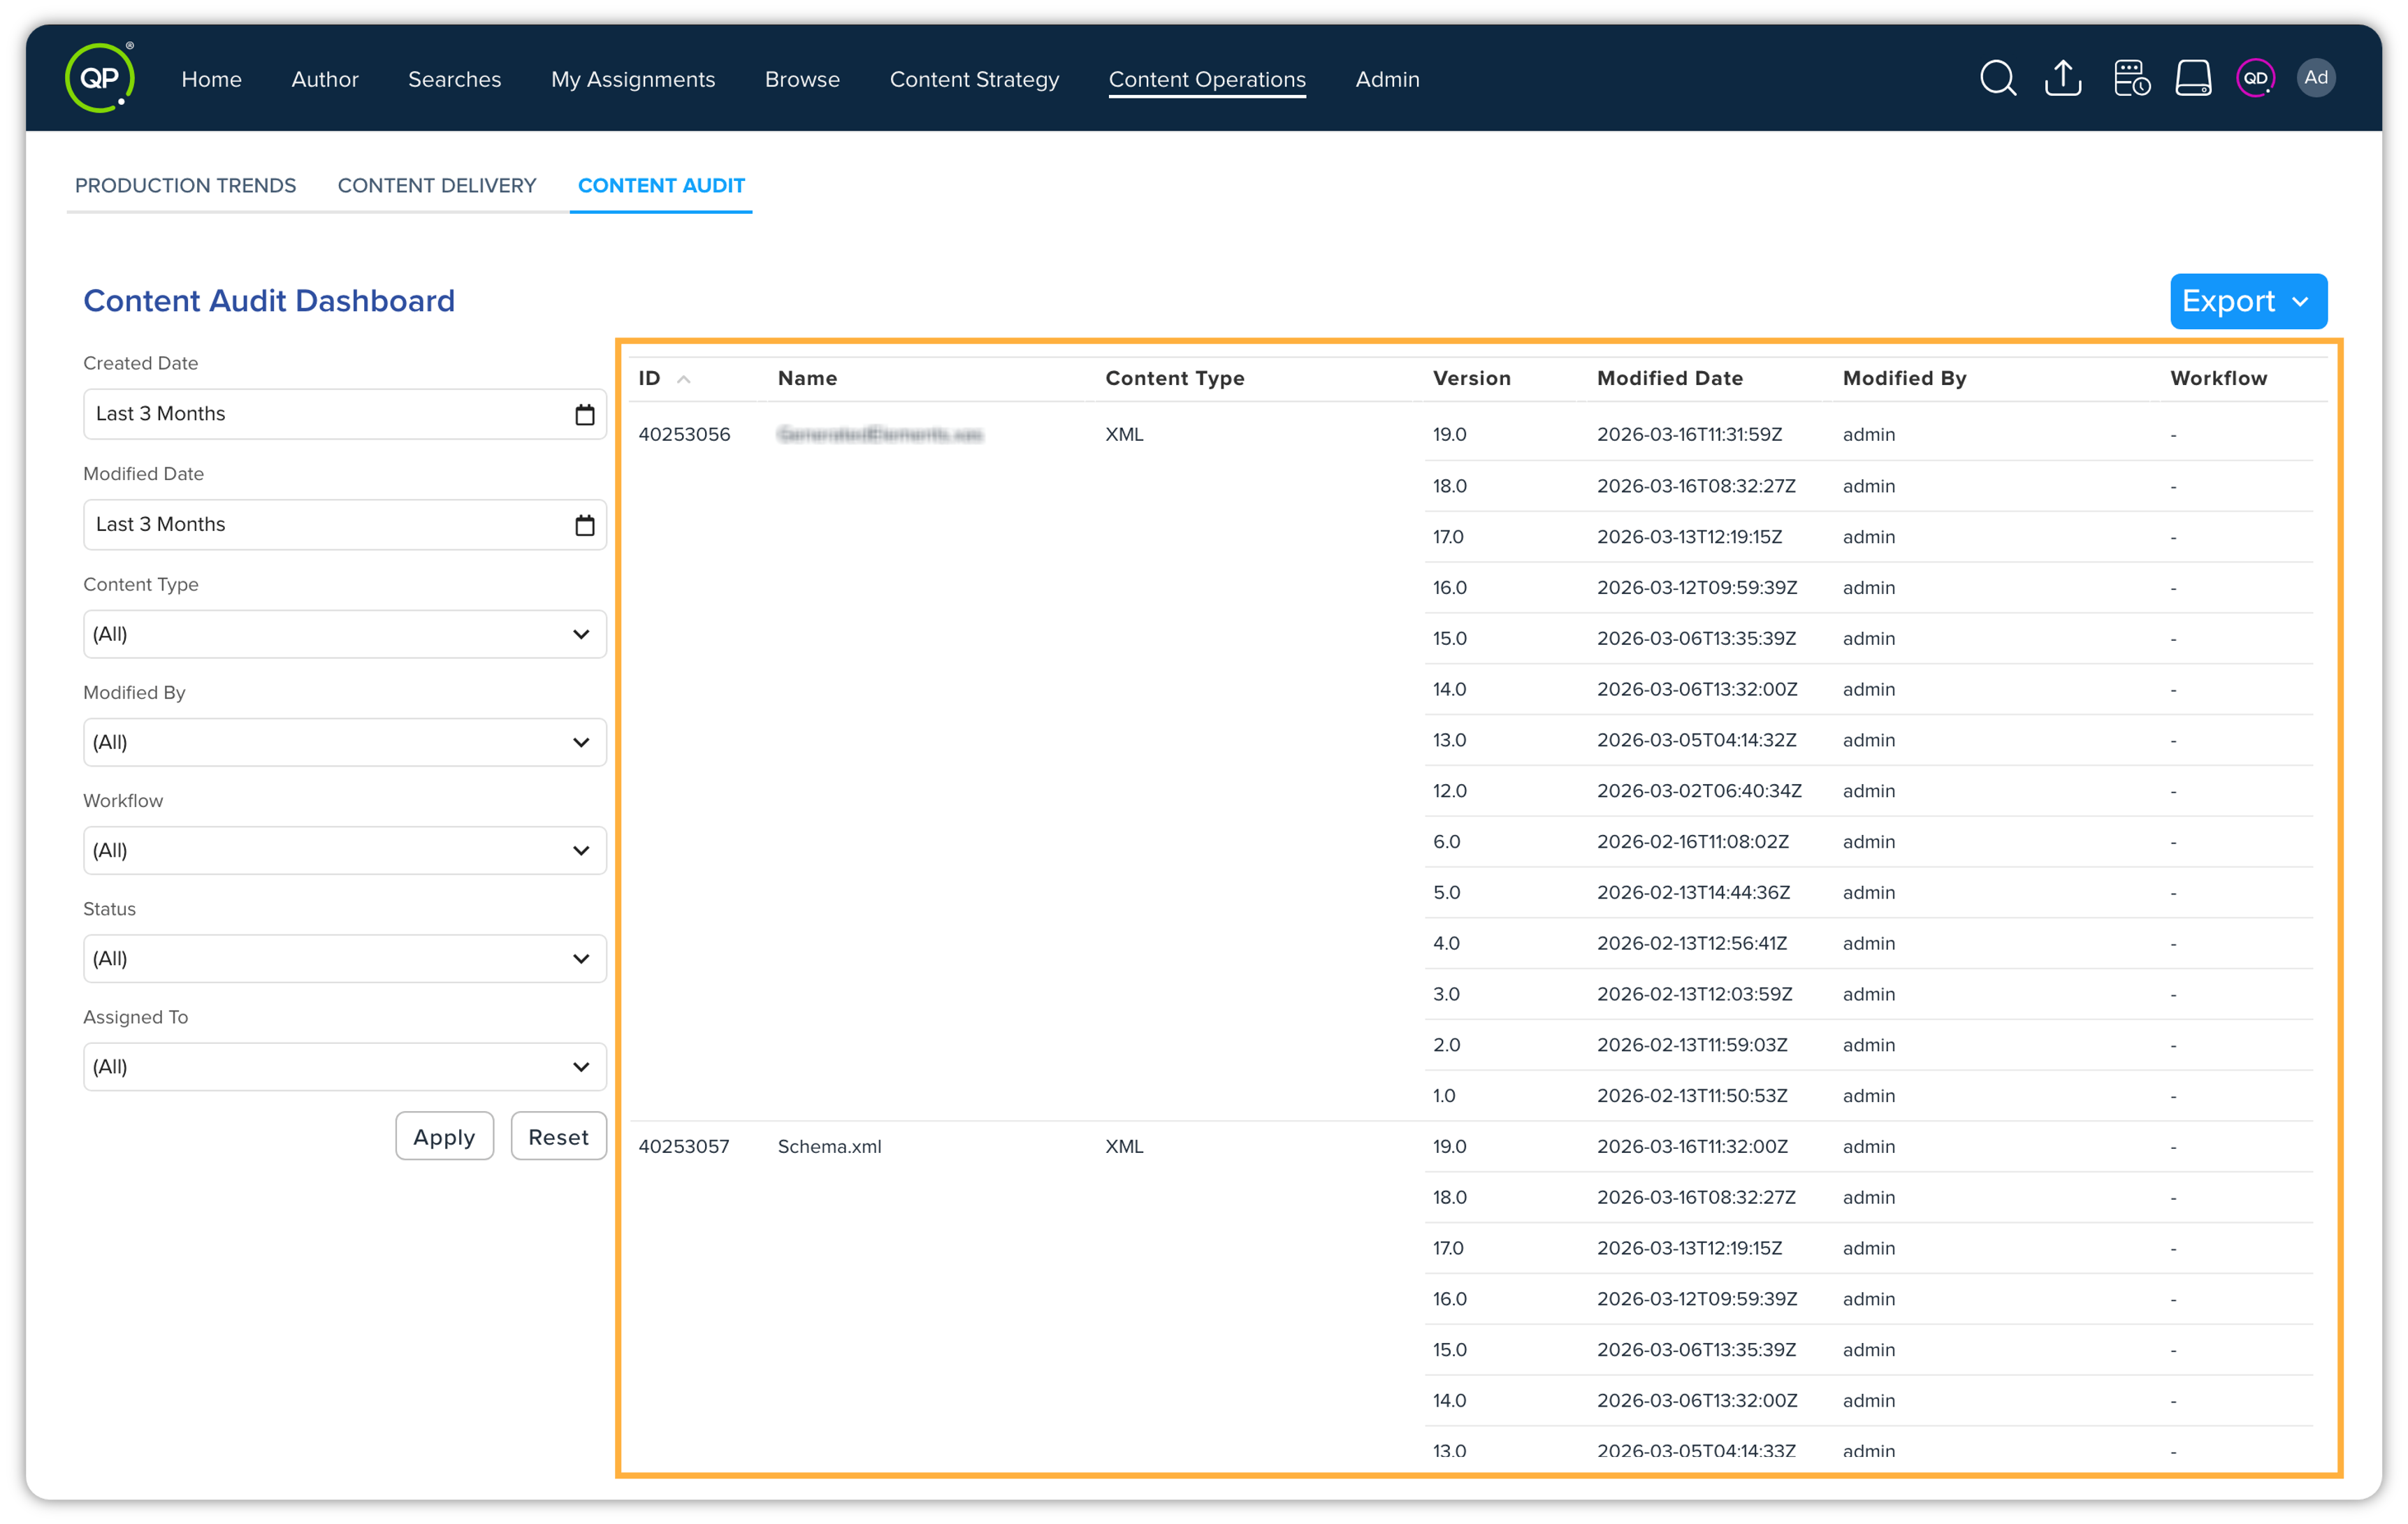
This dashboard includes several columns to display pertinent information –
-
Name: Displays the title or name of the content item.
-
Content Type: Indicates the category or type of content.
-
Current Version: Shows the current version or iteration of the content.
-
Modified Date: Displays the date on which the content was last modified.
-
User Who Modified It: Specifies the user responsible for the most recent modification to the content.
-
Workflow: Indicates the stage of the content's workflow or process.
-
Status: Reflects the current status of the content, providing insight into its progression.
-
Assigned To: Specifies the individual or team to whom the content is assigned.
You can filter the content within the dashboard using different filter options, letting you focus on specific content items based on criteria, such as content type, status, assigned user, workflow stage, and more.
Export Content Audit dashboard
You can export the Content Audit dashboard into an Excel file format or CSV format, enabling you to save the data locally for further analysis, reporting, or integration with other systems.
To export the dashboard, follow the steps shown below –
-
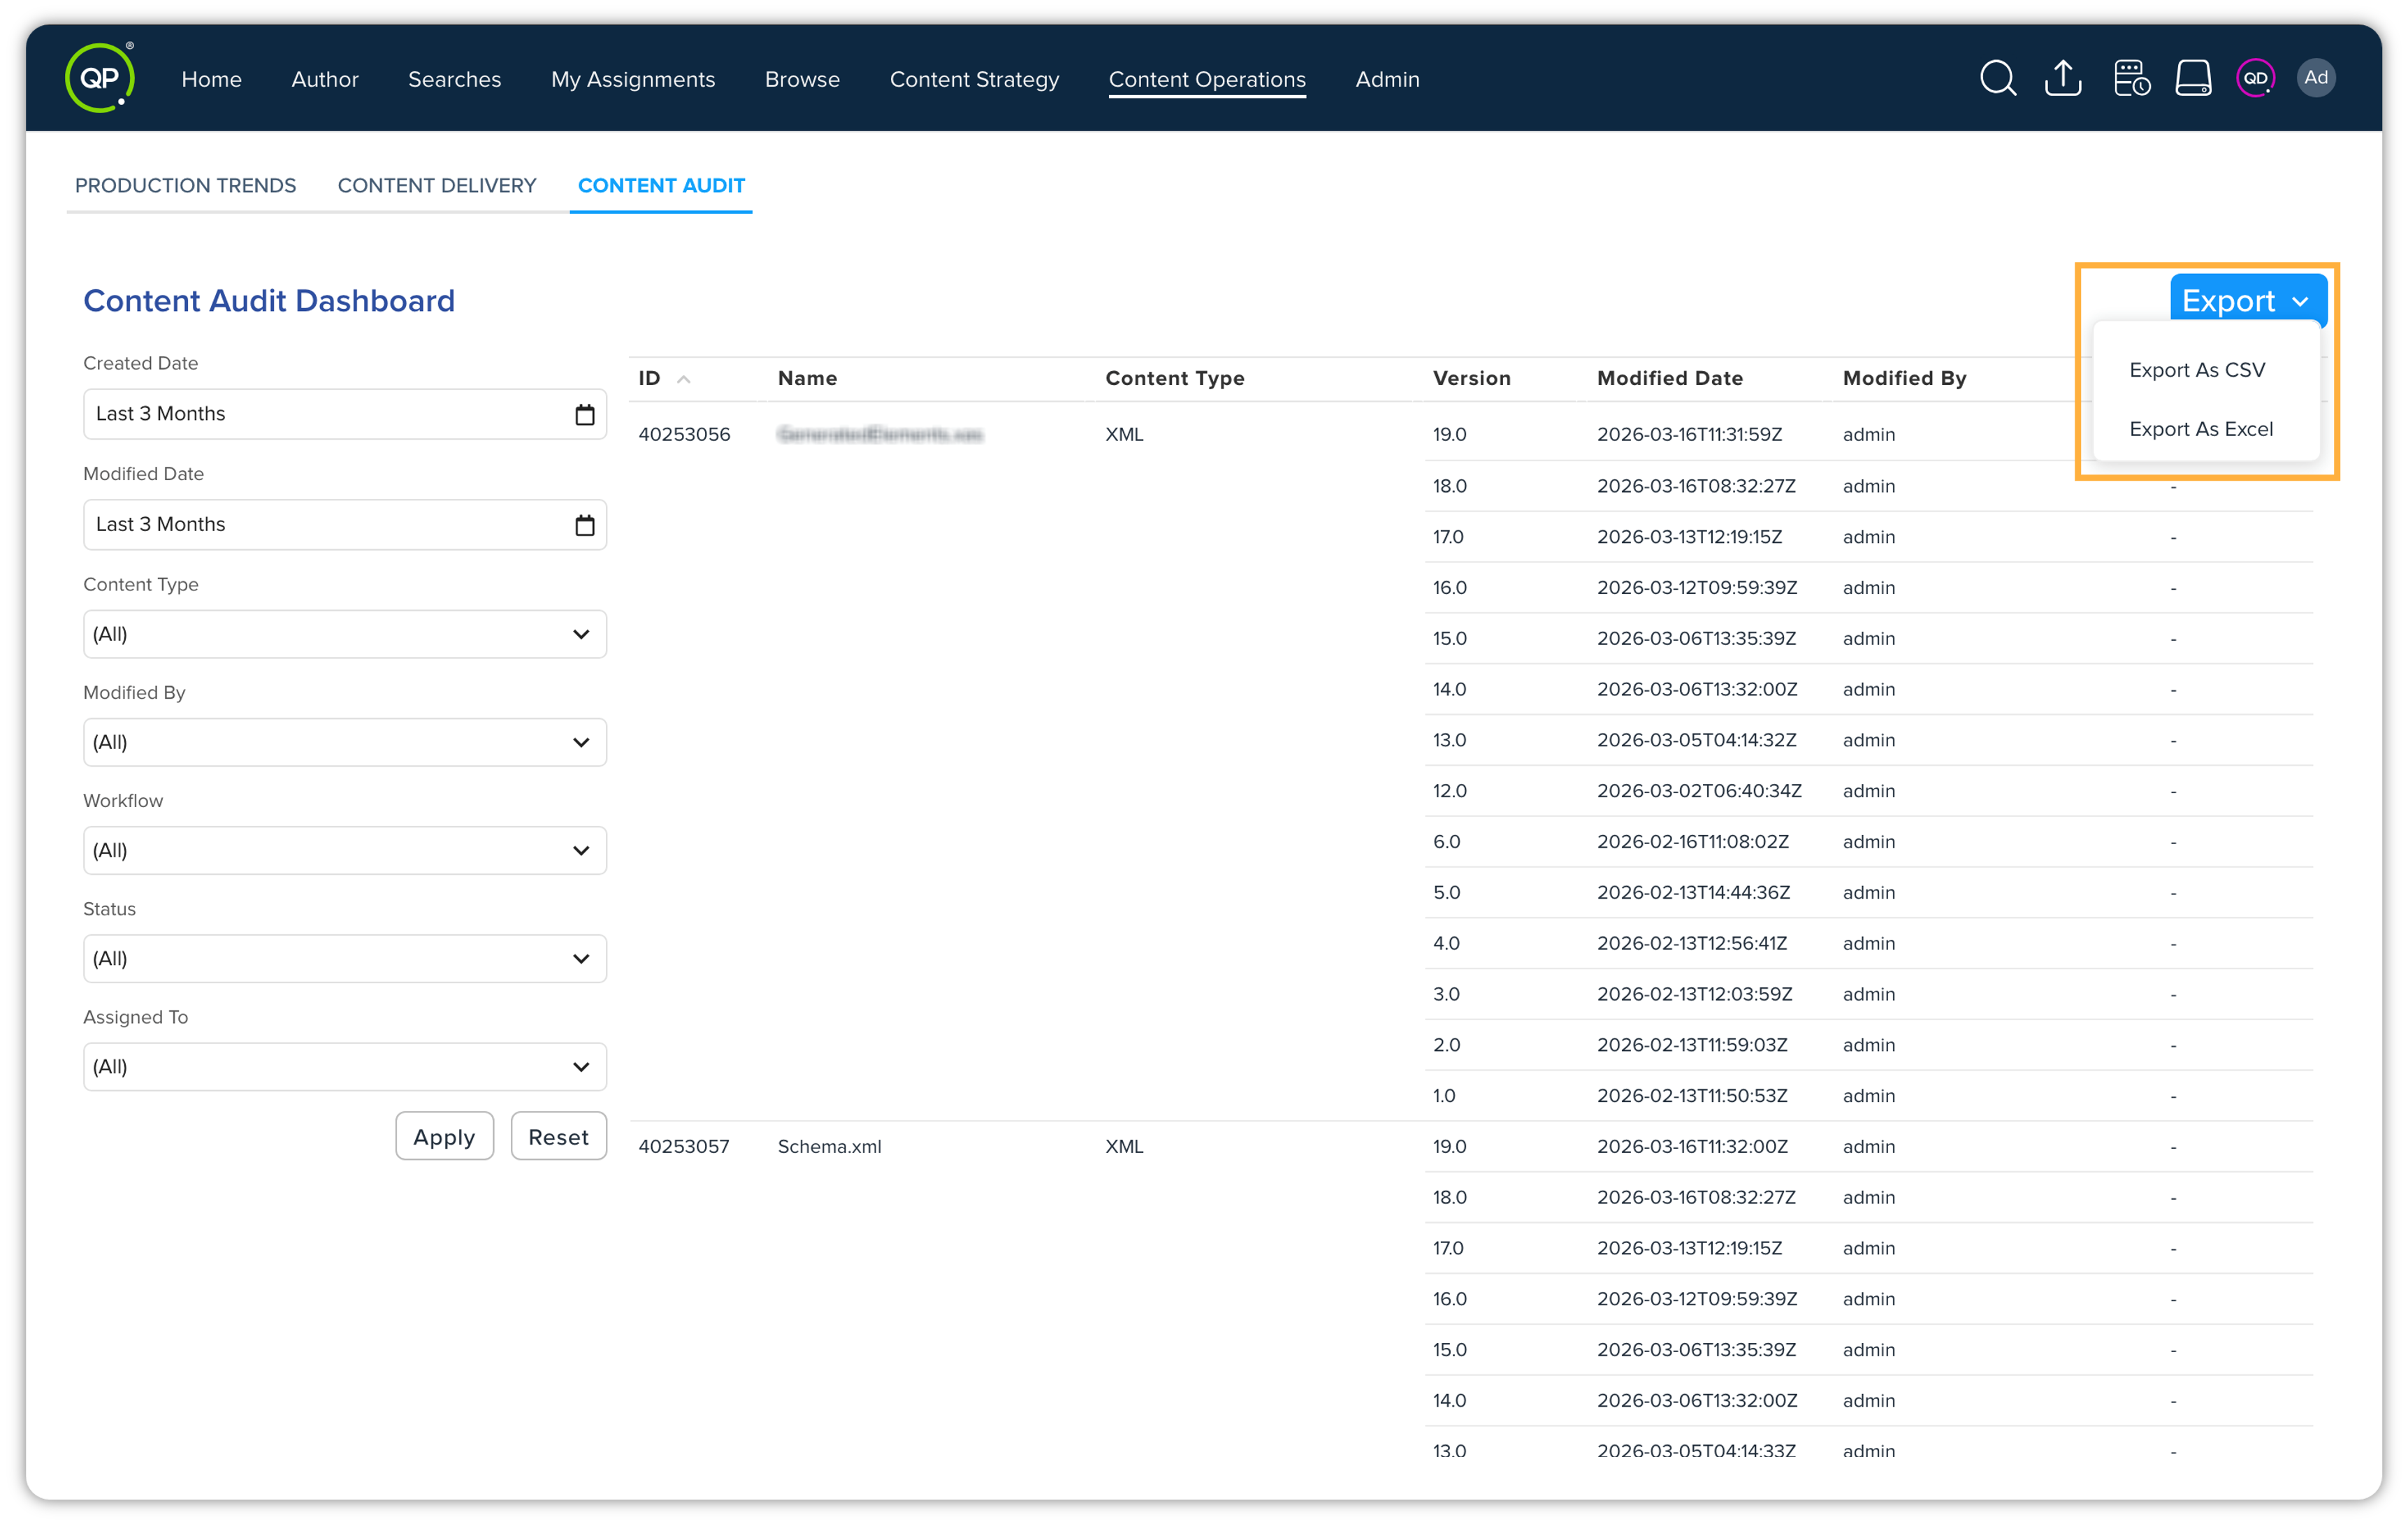
Locate the Export option within the dashboard interface.
-
Choose the desired file format (CSV or Excel).
-
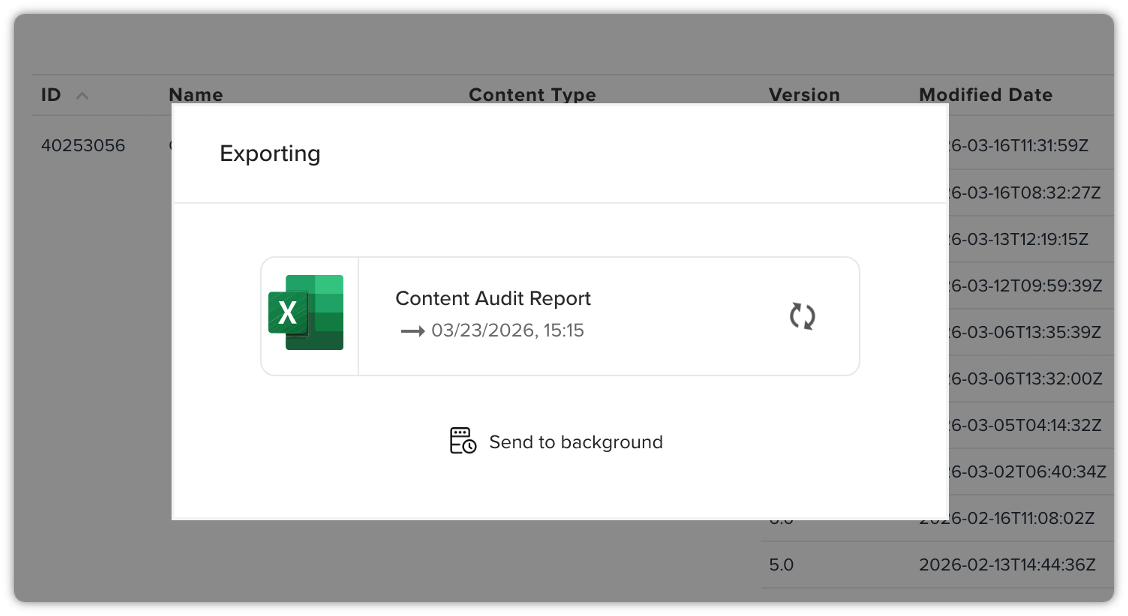
The Exporting dialog pops up showing the exporting process is in-progress. And within a few seconds, the report will be automatically downloaded.
This export feature empowers you to effectively manage and analyze your content audit data, facilitating seamless reporting and external analysis.